

Background Story
Imagine you’re a product specialist preparing for market entry pitches, interview demos, or OKR alignment in fintech, healthcare, or AI scale-ups, you face a familiar battle. You’ve got PESTEL analyses, Porter’s Five Forces models, and OKRs to define, but pulling together GDP growth, demographic shifts, education metrics, and health indicators from World Bank, IMF, WHO, and UNESCO feels like navigating a labyrinth of outdated CSVs and API quirks. Each source has unique schemas, refresh cadences, and gaps, like missing debt-to-GDP for emerging markets, leaving you stitching together Excel nightmares, second-guessing data integrity while your prep time evaporates.
Now envision applying those frameworks to pinpoint growth pockets or regulatory risks across regions. Spotting correlations between education levels and AI adoption readiness, or tying political stability to supplier power, unlocks killer insights, but without automated merging and interactive views, you’re trapped in repetitive data wrangling instead of strategic storytelling that wows interviewers or execs.
Those familiar battles with scattered data sources and endless wrangling soon boil down to five specific pain points. Each one compounds the frustration, turning what should be strategic insight into a slog of manual fixes and doubt. They hit hardest when deadlines loom and your focus should be on the big picture, not the spreadsheet.
Data Sourcing Nightmares
Reliable country statistics require hopping between World Bank, IMF, UN, and national databases, each using different formats, schedules, and access rules. The result is often a patchwork of incomplete datasets and version mismatches that turn your analysis into a Frankenstein of inconsistent numbers.
Inconsistent Metrics Mayhem
Metrics such as GDP per capita or growth rates vary widely across sources. Some adjust for purchasing power parity, others do not. Manually normalizing for currencies and population sizes invites errors that skew comparisons, especially between small islands and economic giants like China.
Time-Sucking Processing
Downloading CSV files, cleaning duplicates, handling missing values, merging tables in Excel, and building pivot charts can take days. Since the process isn’t automated, your reports quickly become outdated snapshots by the time leadership asks for an update.
Error-Prone Analysis
Manual trend analysis and correlation checking often miss regional nuances or outliers. Copy-pasting introduces typos and formula errors, undermining trust in every insight. Before you know it, a critical takeaway rests on a broken VLOOKUP.
No-Interaction Stagnation
Without interactive filters, maps, or drill-downs, exploring “what if” scenarios, such as comparing Asia’s and Europe’s growth trajectories, means starting from scratch every time. This limits curiosity and produces static, forgettable reports.
Now imagine a different scenario. You’re a savvy product specialist deep in market strategy work, and those manual data hunts are a thing of the past. A tool steps in as a reliable partner, automatically merging datasets from WHO, IMF, and World Bank into clean, analysis-ready formats covering GDP, population, education, and more. No more spreadsheet battles or format frustrations. You can finally focus on crafting compelling narratives, weaving PESTEL insights, and highlighting Porter’s Five Forces opportunities that captivate stakeholders.
The best part is that this personal project I recently built does exactly that. It eliminates the technical grind so you can focus on discovery and strategy. The platform delivers up-to-date, interactive data enriched by an LLM that connects relevant news, reports, and correlations for deeper insights. You can ask, “What’s the real opportunity in Southeast Asia?” and instantly receive tailored visuals and a narrative summary, giving you time to focus on the big-picture storytelling that turns you into the hero of the boardroom.
Product Definition
Say hello to the Country Analytics Platform, a personal project I built to transform data chaos into clarity. This web-based tool brings together key metrics such as GDP, population, education levels, and age demographics from trusted sources including the WHO, IMF, and World Bank. It automates the tedious parts of data collection so you can skip the spreadsheet struggle and focus directly on strategic insights.
The platform is an analyst-grade web application designed for exploring country-level financial, demographic, health, and education data from the year 2000 up to the latest available period. It draws from reputable sources like the World Bank WDI, IMF WEO, UNESCO UIS (via WDI), REST Countries, and Sea Around Us. When World Bank data is missing, for instance, government debt as a percentage of GDP for China, the system automatically fills it using IMF WEO figures to ensure completeness and consistency.
By handling data cleaning, merging, and updates automatically, the platform saves you hours of manual work. You receive clean, normalized datasets ready to fuel frameworks such as PESTEL and Porter’s Five Forces without the frustration of mismatched formats. It also invites curiosity through intuitive, interactive exploration, helping you uncover market readiness and opportunities faster than it takes to brew a cup of coffee. With the groundwork handled, you can concentrate on crafting the narratives that close deals and drive strategy forward.
You can check the platform through the following link here
Product Benefits
The Country Analytics Platform delivers a range of powerful benefits that make country-level research faster, more credible, and easier to navigate.
- Fast insights: Get a single-country summary with year-over-year changes in seconds, allowing quick comparisons and trend identification.
- Credible data: Built on authoritative sources such as the World Bank WDI, IMF WEO, REST Countries, and Sea Around Us, with fallbacks in place for territories or missing data.
- Intuitive user experience: Includes a searchable country selector, preset year filters, and frequency toggles for quick exploration.
- Transparent methodology: A dedicated source tab documents every metric, including formulas and direct source links, to ensure clarity and trust.
- AI-assisted Insights: Assistant prioritizes platform data, augments via TAVILY for real-time context, and leverages GROQ for structured PESTEL or Porter reports, all with full attribution.
- Export-Ready Outputs: Download visuals and summaries for presentations or PRDs.
- Source attribution: Each chat response clearly displays its data origin, model name, or web search reference.
- No login required: All features are open-access, using public data with no authentication or workspace setup needed.
Core Value Proposition
The Country Analytics Platform offers a single, unified interface designed to make data exploration, comparison, and strategic analysis simple and powerful.
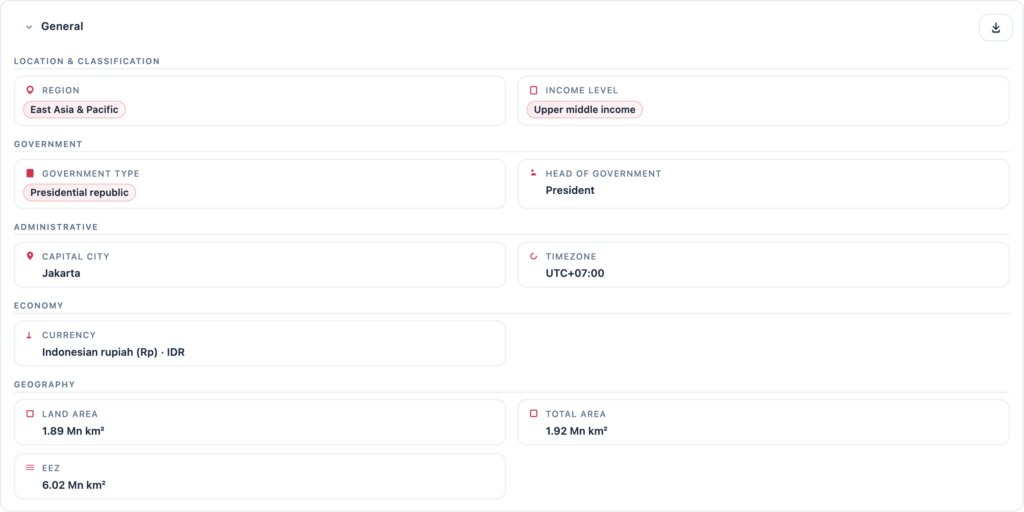
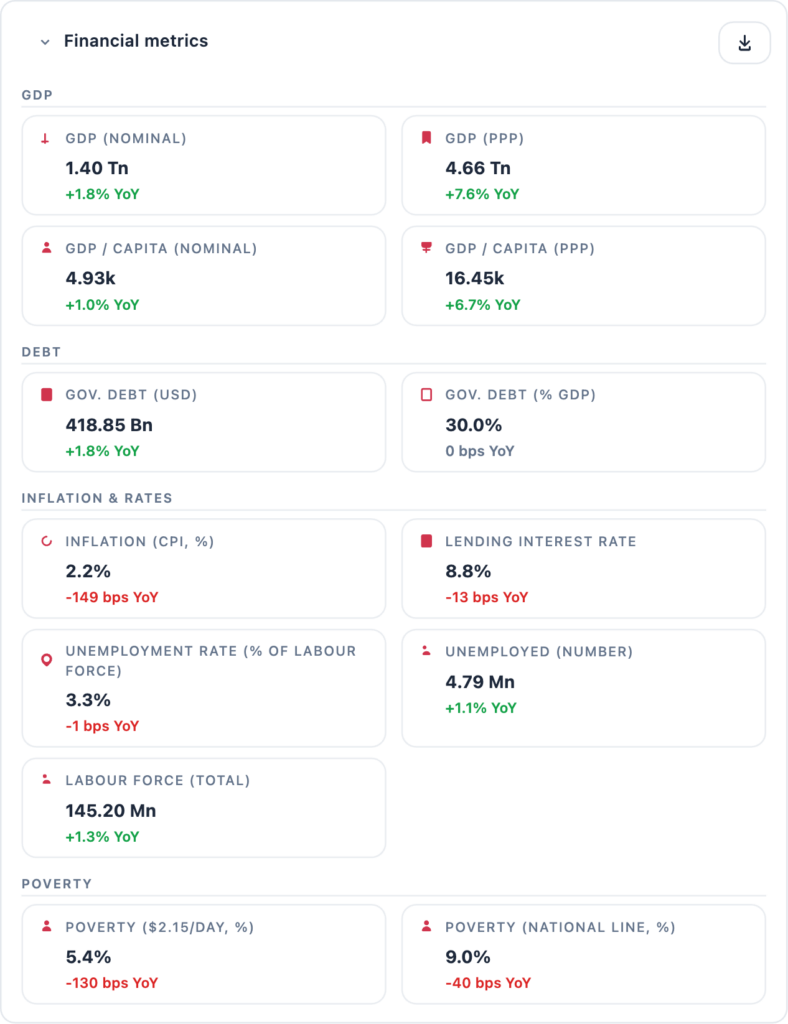
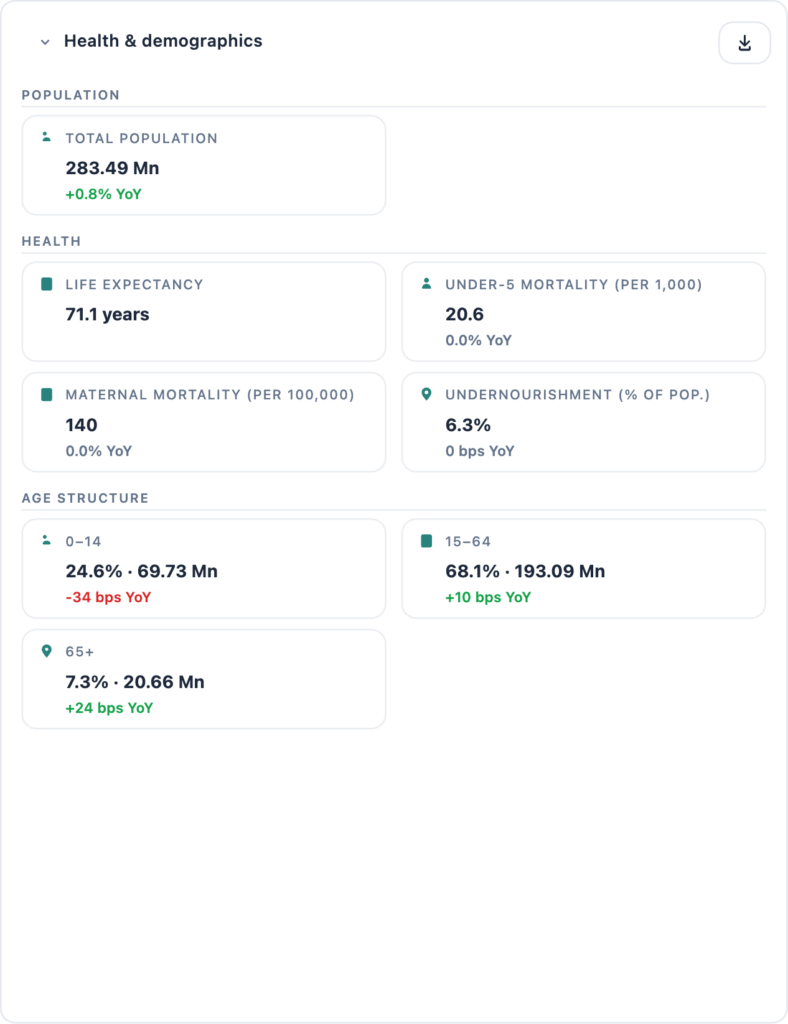
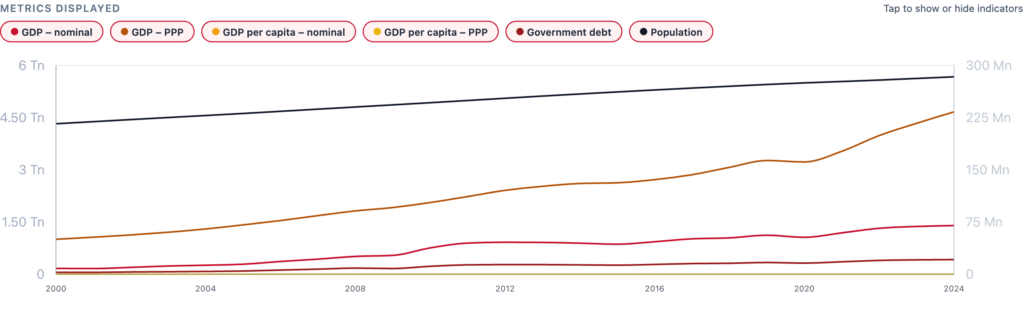
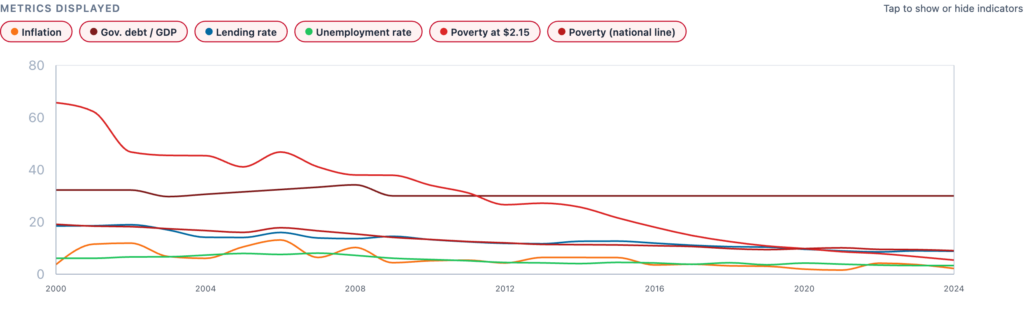
- Explore: Dive into detailed country profiles covering GDP, population, age structure, life expectancy, government debt, and geography.
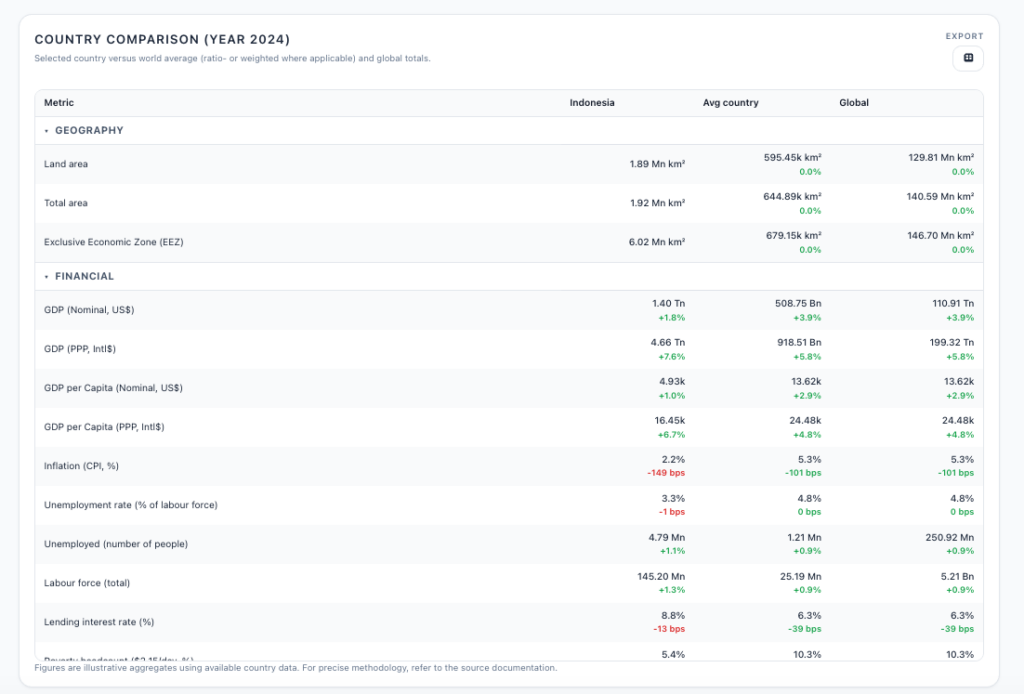
- Compare: Analyze countries over time through trends, year-over-year changes, rankings, and side-by-side comparisons.
- Understand: Access transparent data methodology in the Source tab, complete with metric descriptions, formulas, and direct source links.
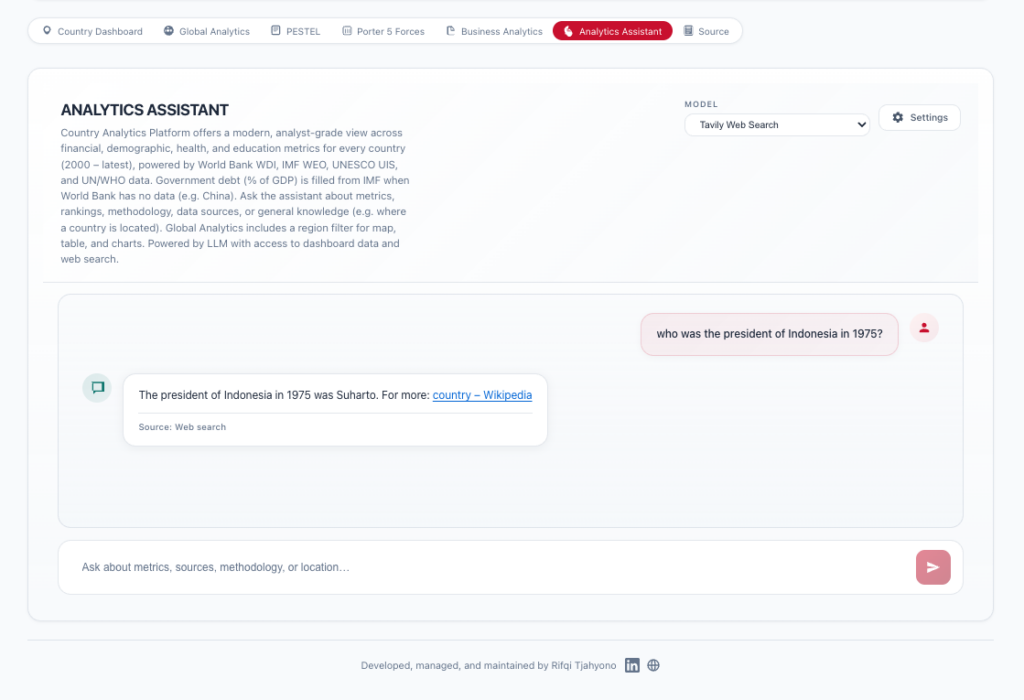
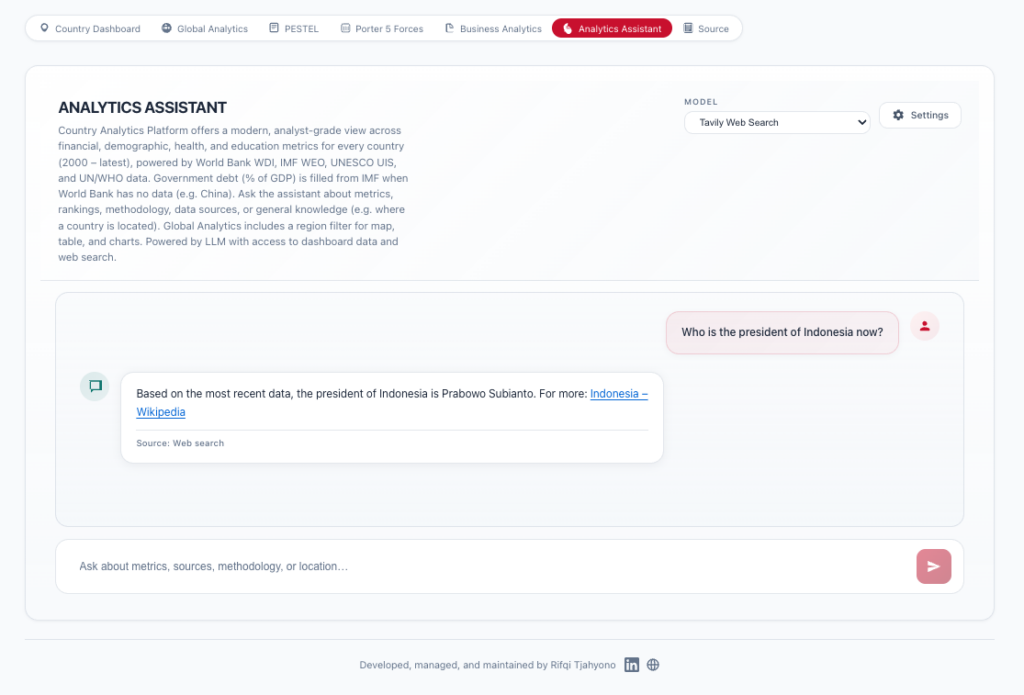
- Ask: Use the Analytics Assistant to pose natural-language questions powered by cascading logic. It always draws from Dashboard data first for metrics within scope. For general knowledge or supplementary information, it retrieves the latest details through TAVILY, then turns to GROQ as the main language model, and finally other LLMs if needed. Porter’s Five Forces and PESTEL analyses follow the same sequence, using TAVILY for current-year context and GROQ to generate structured reports. Every response includes clear source attribution for full transparency.
- Interactive visuals: Drag, filter, and compare countries or regions using dynamic maps, charts, and trend views that make insights instantly visible.
- Framework boost: Access pre-built templates for correlation and causation analysis, PESTEL scans, and competitive forces exploration.
- LLM-powered insights: Chat with your data to generate tailored narratives, link the latest news, and produce deep-dive reports for any audience.
- Export magic: Download presentation-ready visuals and summaries with a single click to share your findings instantly.
Target Audience
The Country Analytics Platform is designed to effectively serve its target audience by delivering accessible insights, credible data, and intelligent analysis tailored to their needs.
| Audience | Use Case |
|---|---|
| Strategy & analytics teams | Board reports, regional planning, market prioritisation |
| Country / regional heads | Quick country snapshots and peer comparisons |
| Economists & policy analysts | Trend analysis, structural shifts, research validation |
| Market expansion managers | Market sizing, demographic structure, growth evaluation |
| Researchers & students | Clean, explorable interface over public macro data |
Key Features
The Country Analytics Platform is designed and developed around several key features that together make global data exploration, analysis, and storytelling effortless and insightful.
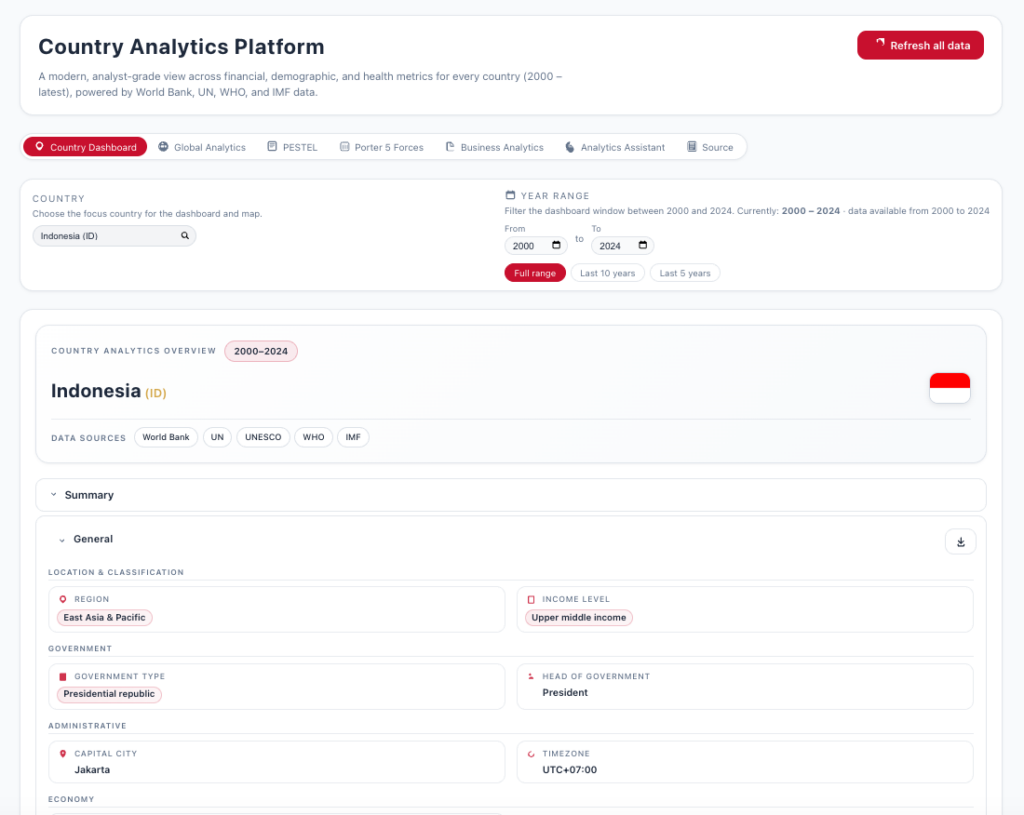
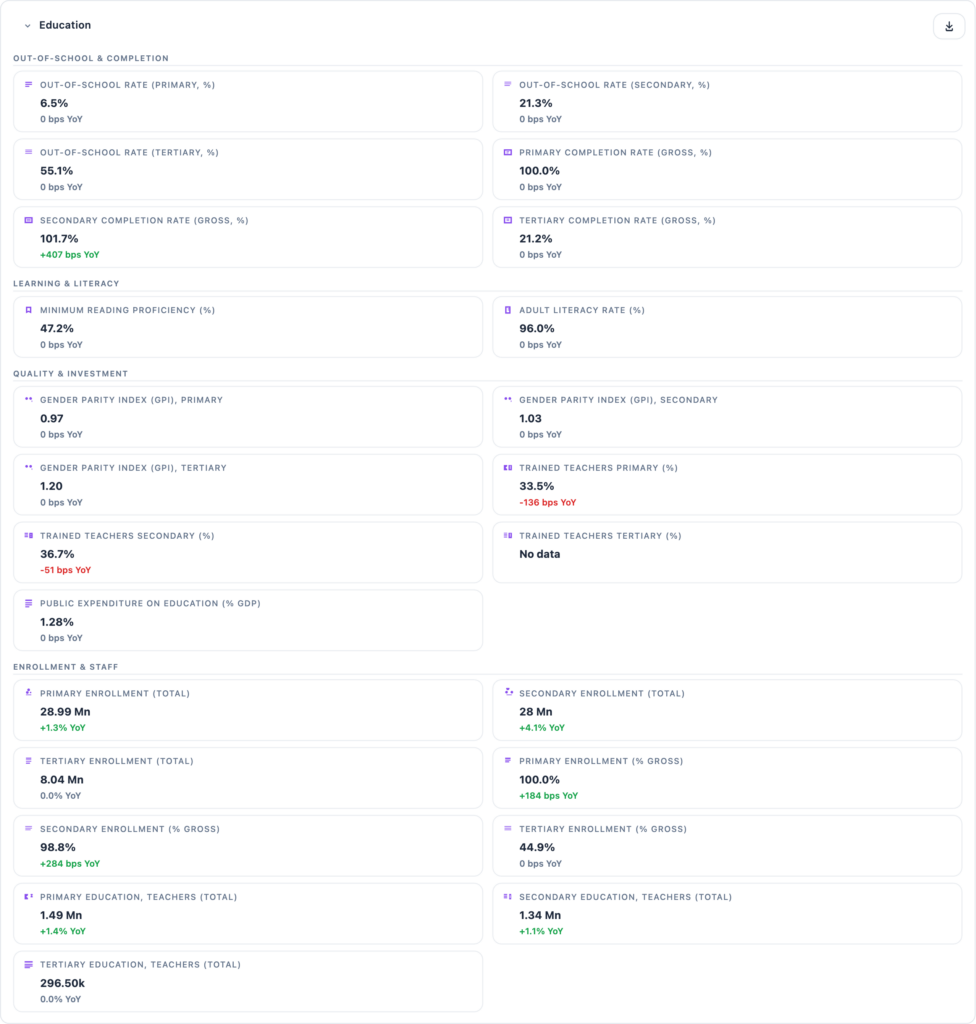
Country Dashboard
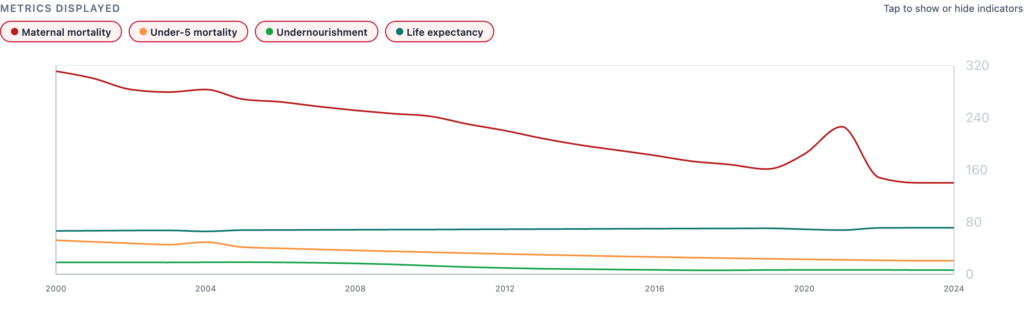
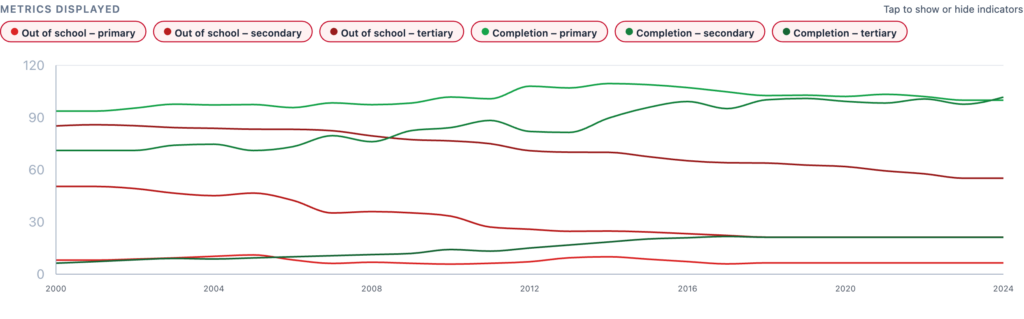
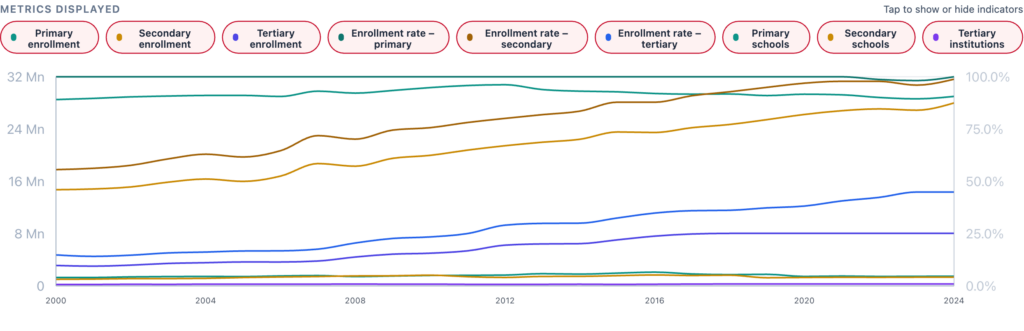
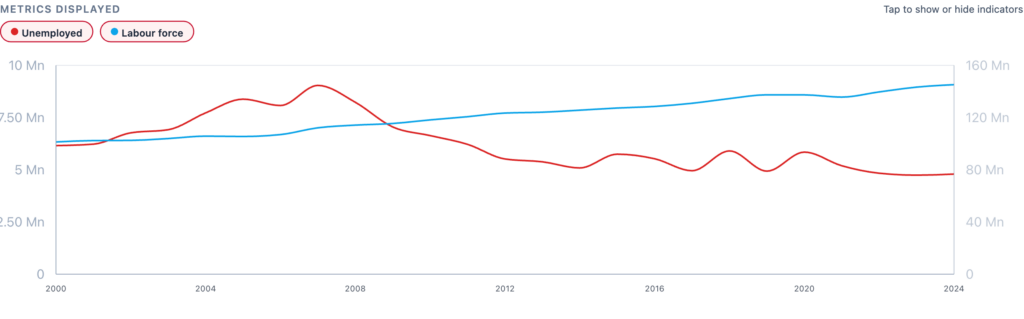
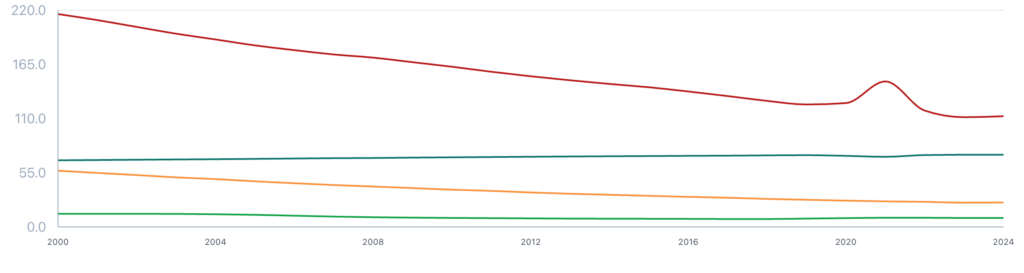
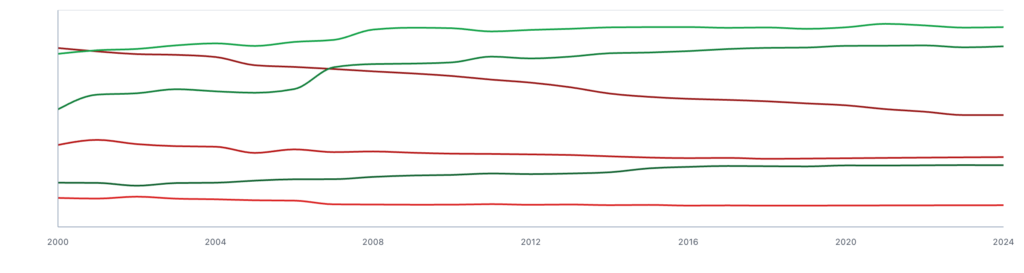
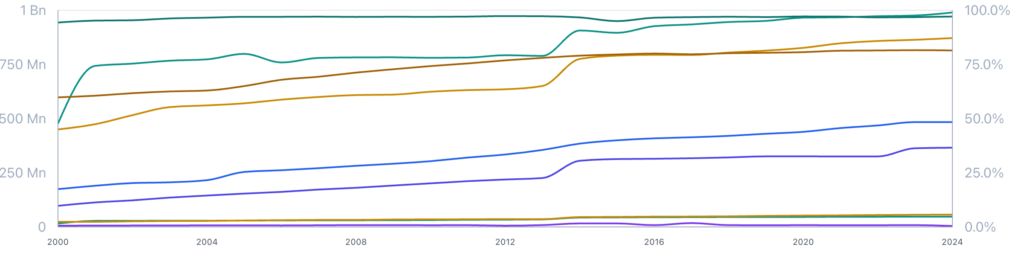
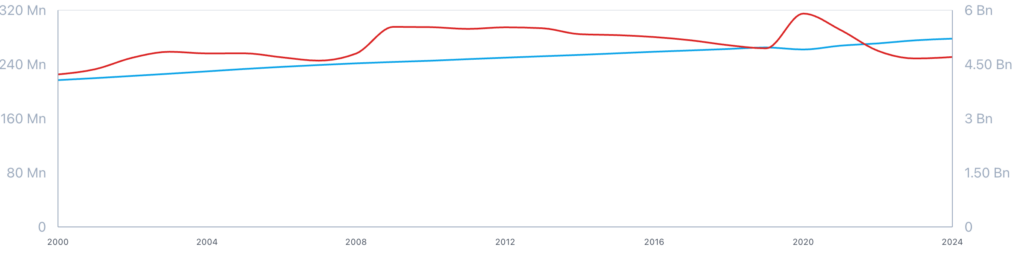
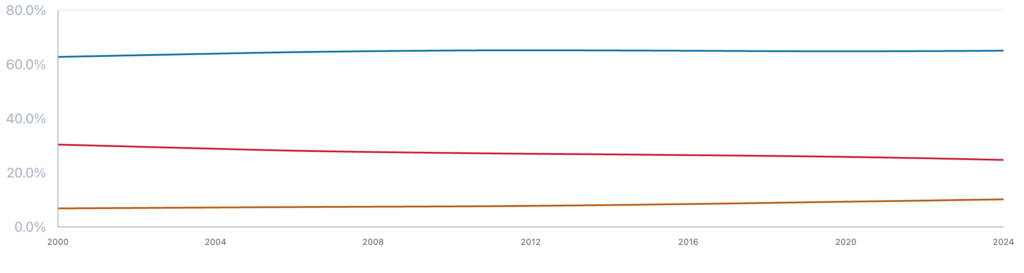
The Country Dashboard is the core feature of the platform, providing an interactive hub for exploring essential metrics such as GDP, population, education rates, and age demographics from credible sources like the WHO, IMF, and World Bank. Users can select countries or regions to view dynamic visualizations, including charts, trend lines, and comparison tables, that update in real time to support fast, seamless analysis.
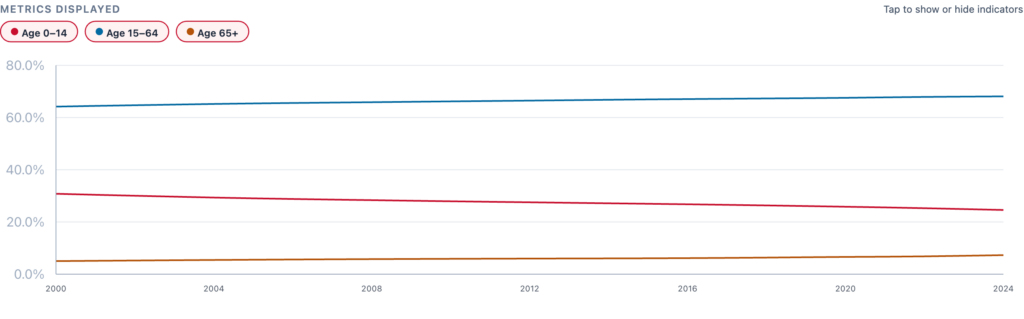
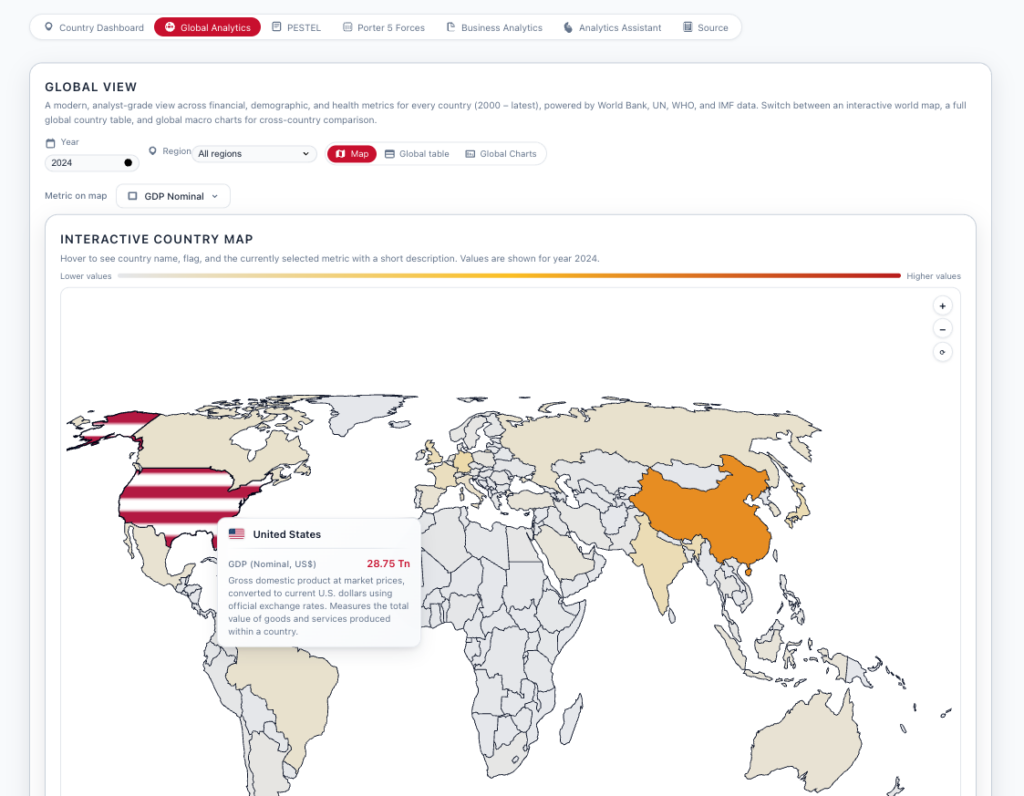
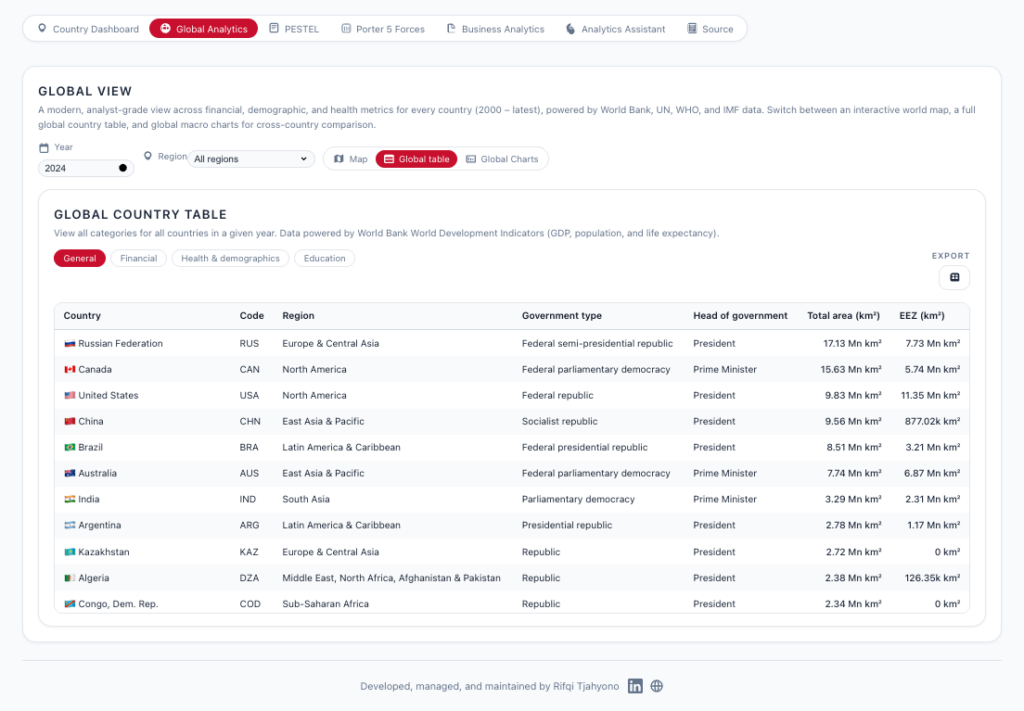
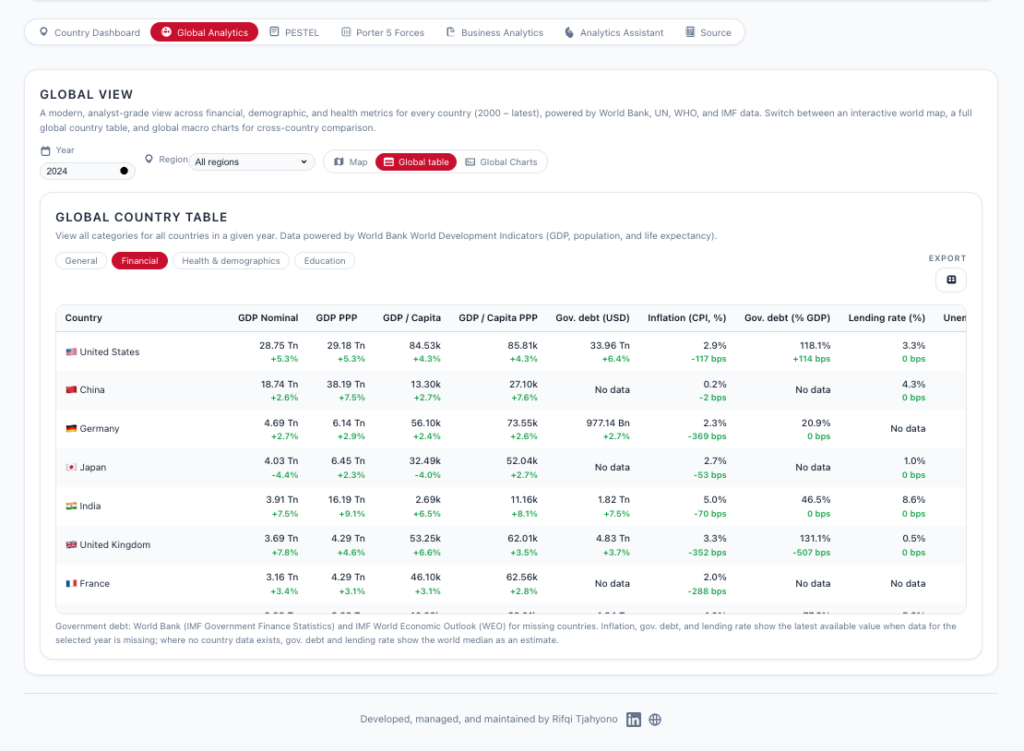
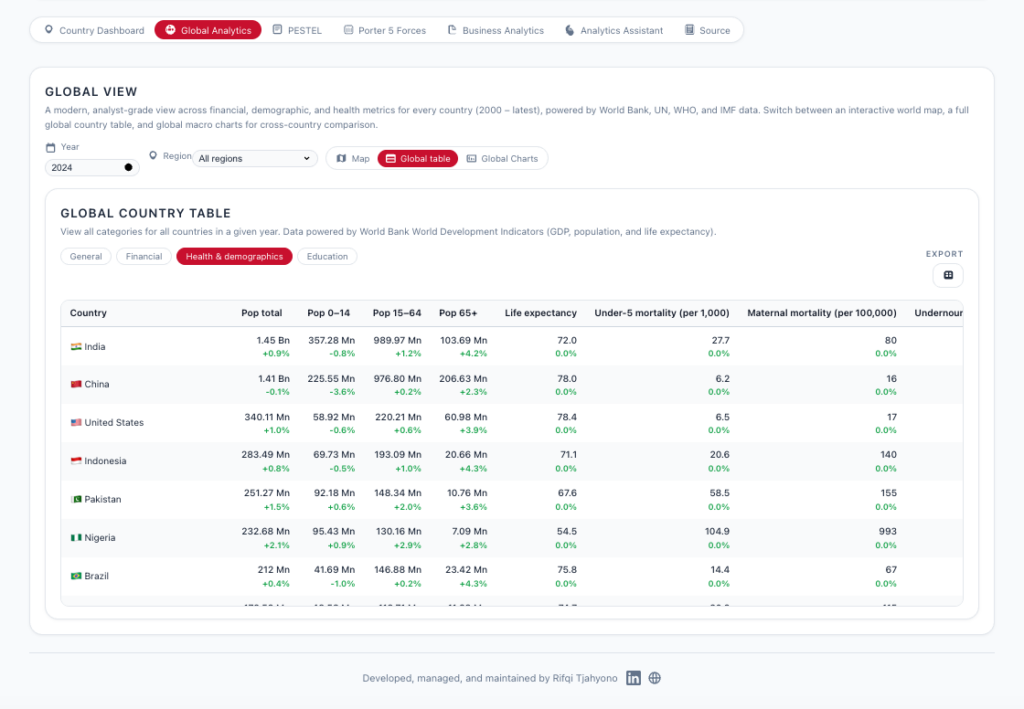
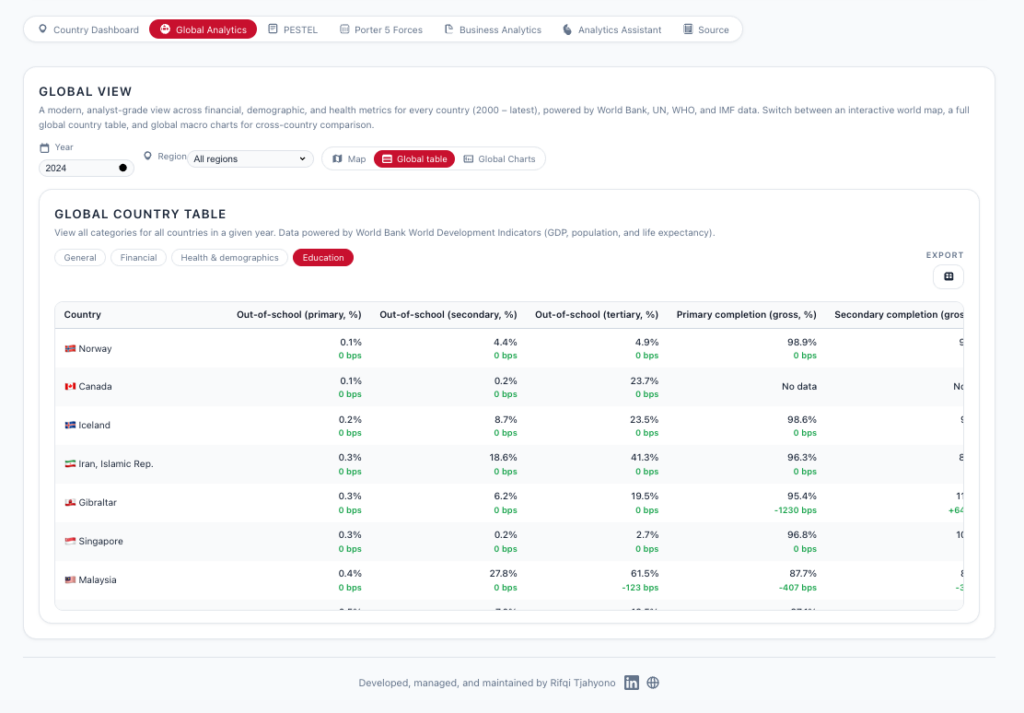
Global Analytics
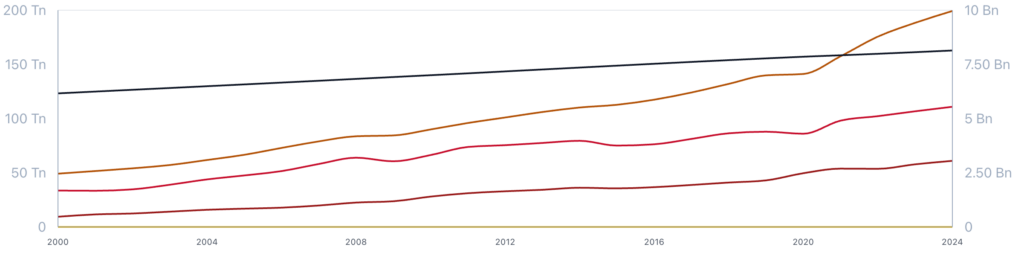
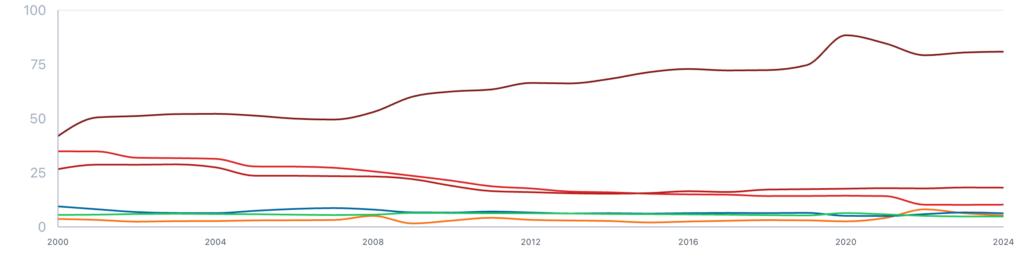
The Global Analytics feature offers a high-level overview of worldwide trends across key indicators such as GDP growth, population shifts, education indices, and health outcomes. Drawing data from the WHO, IMF, and World Bank, it presents aggregated insights through heatmaps, world maps, and summary statistics. This helps users identify regional patterns and global outliers quickly, supporting strategic planning and macro-level assessments.
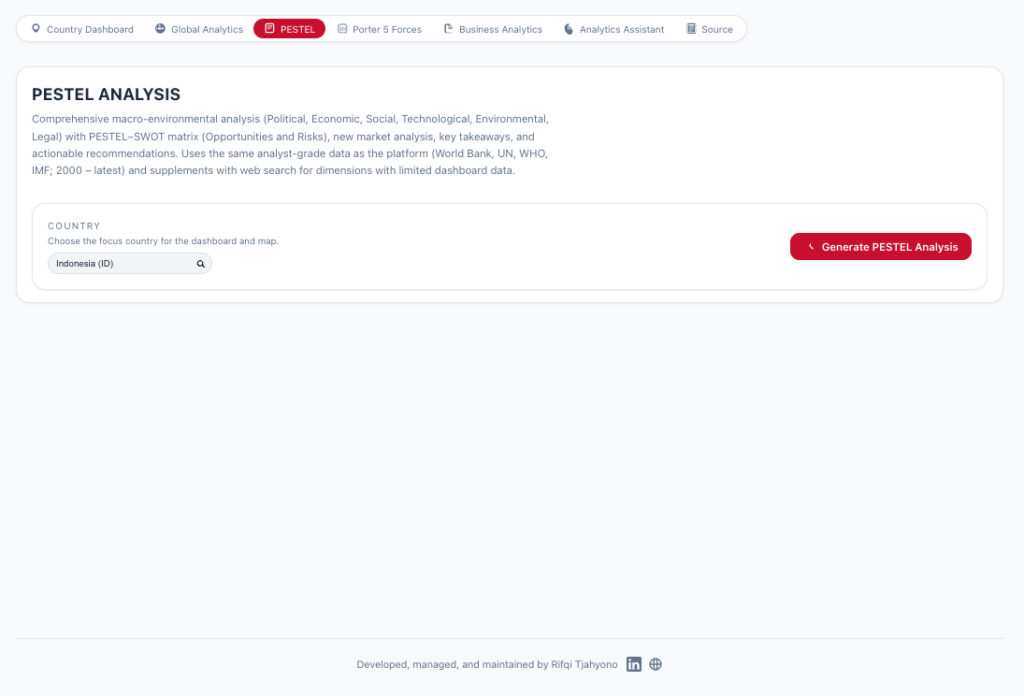
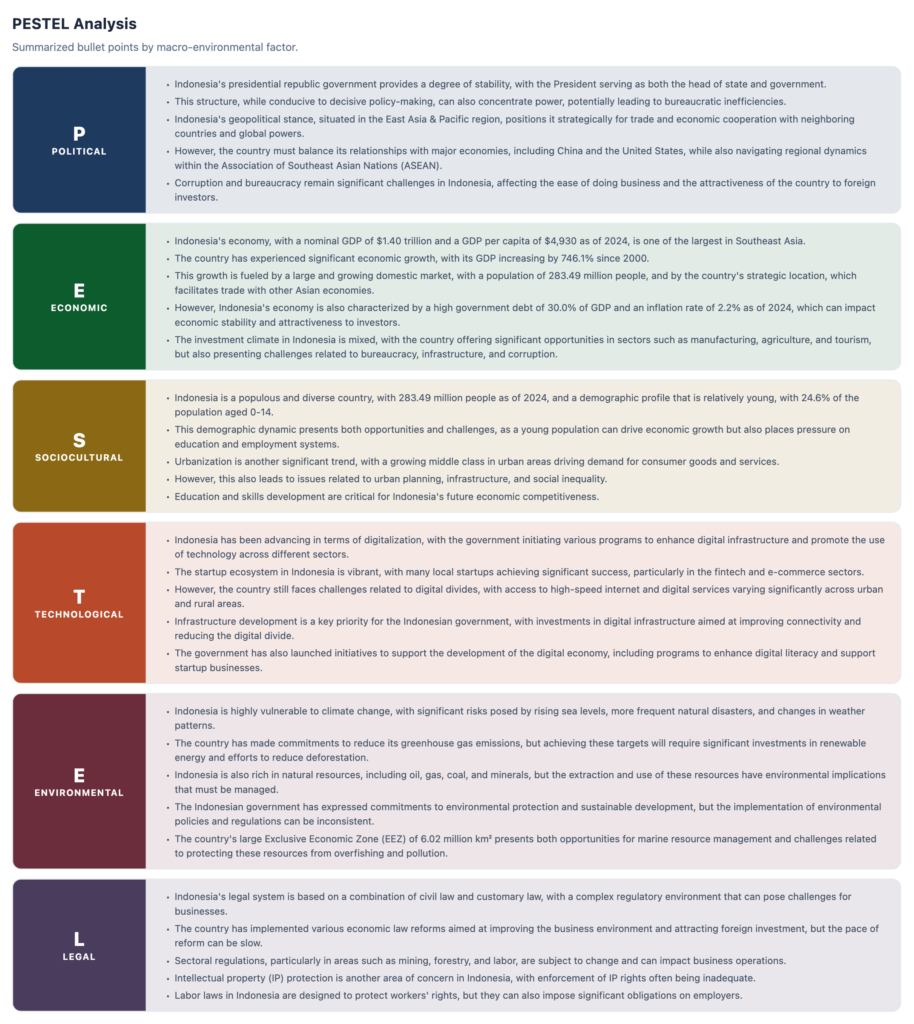
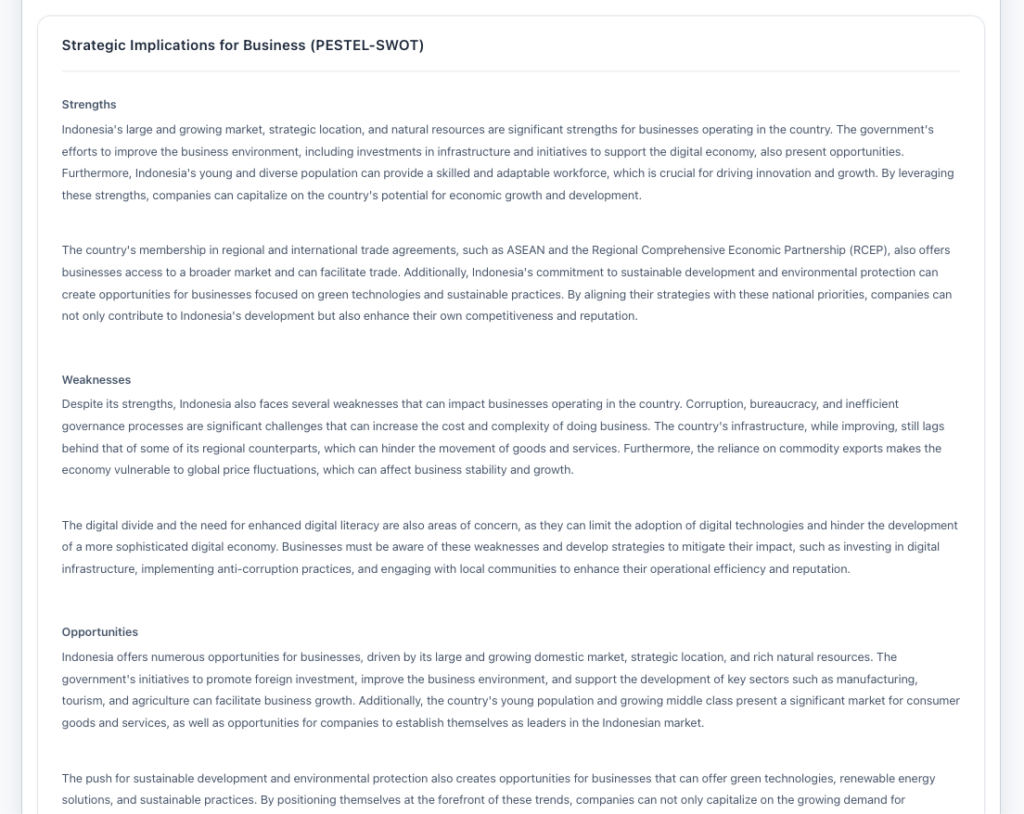
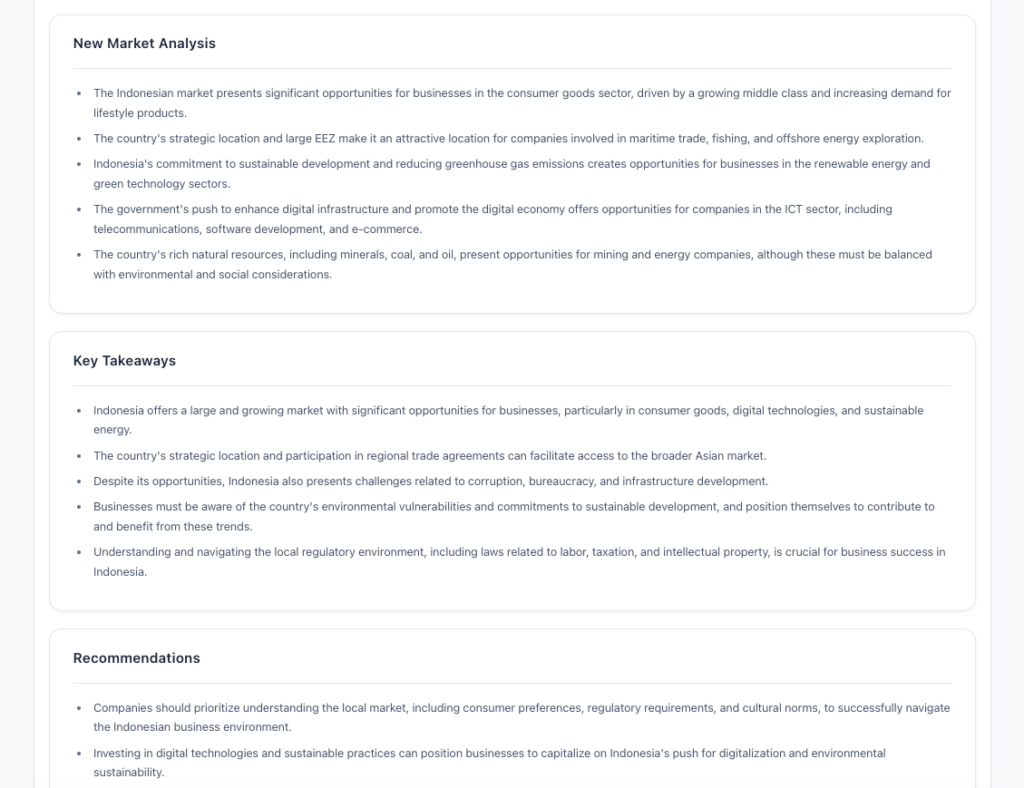
PESTEL
The PESTEL feature applies the classic Political, Economic, Social, Technological, Environmental, and Legal framework directly to country datasets. It automates multi-dimensional analysis with data sourced from organizations such as the WHO, IMF, and World Bank. Users can generate structured summaries covering political stability, economic growth, social demographics (including education and age groups), technological adoption rates, environmental indicators, and legal risk factors. Insights are visualized through radar charts and summary tables for clear, strategic overviews.
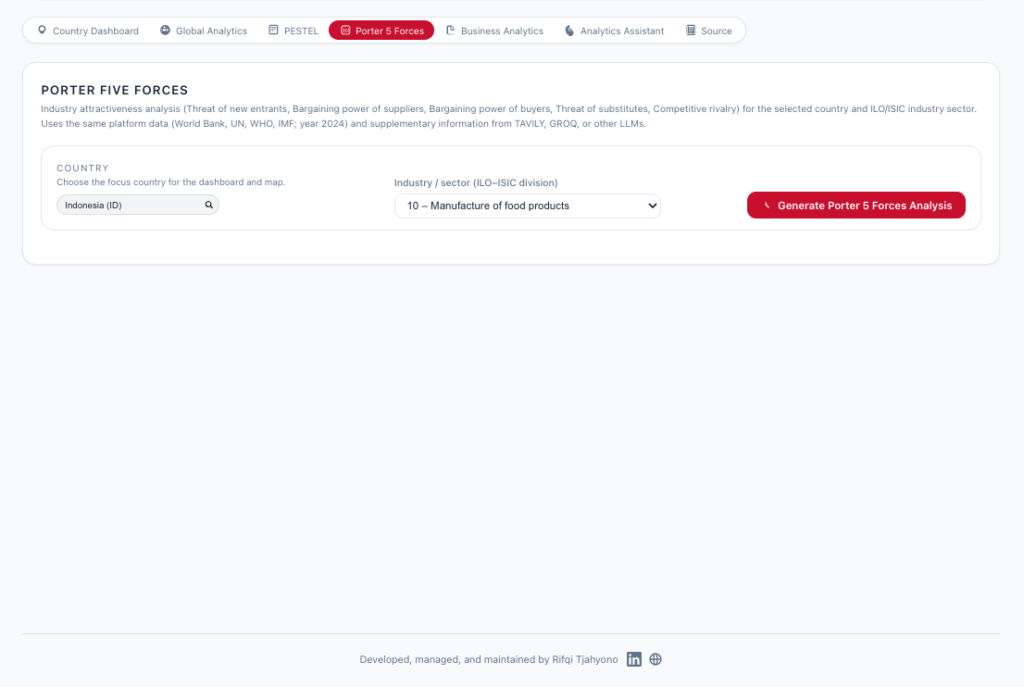
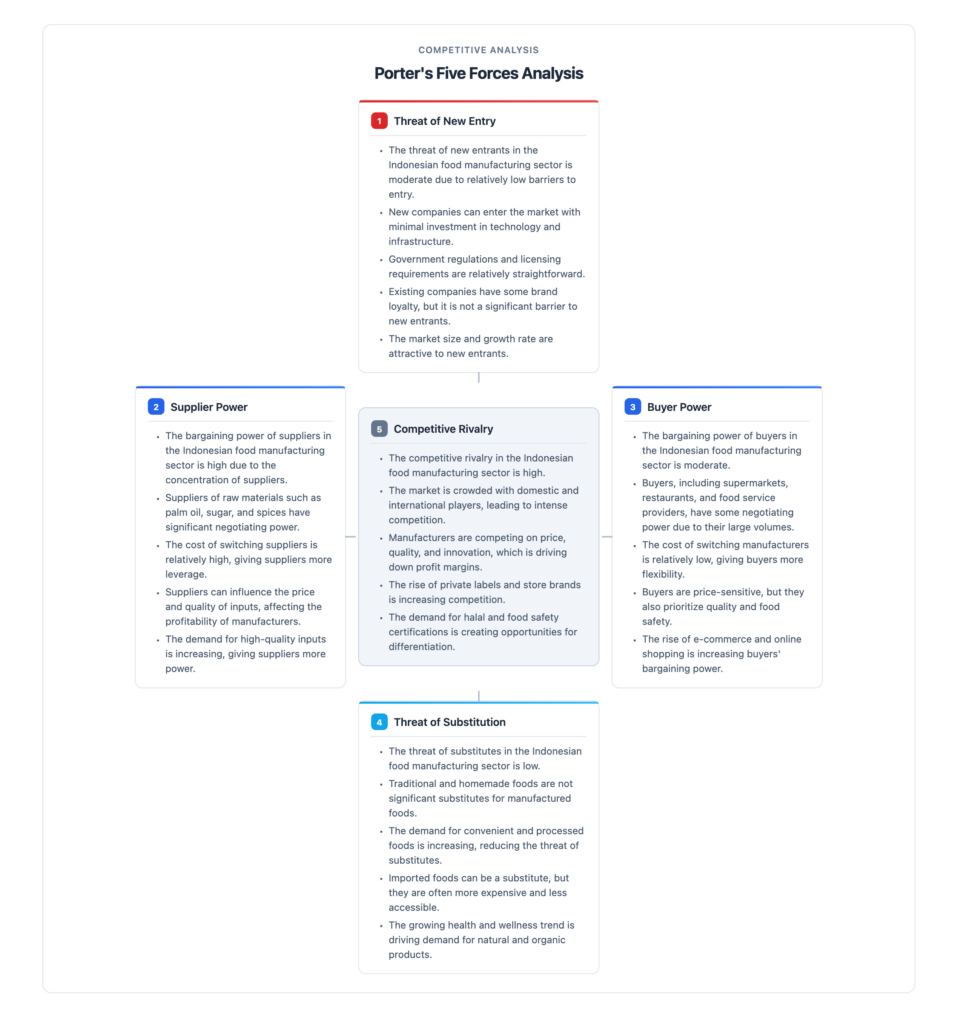
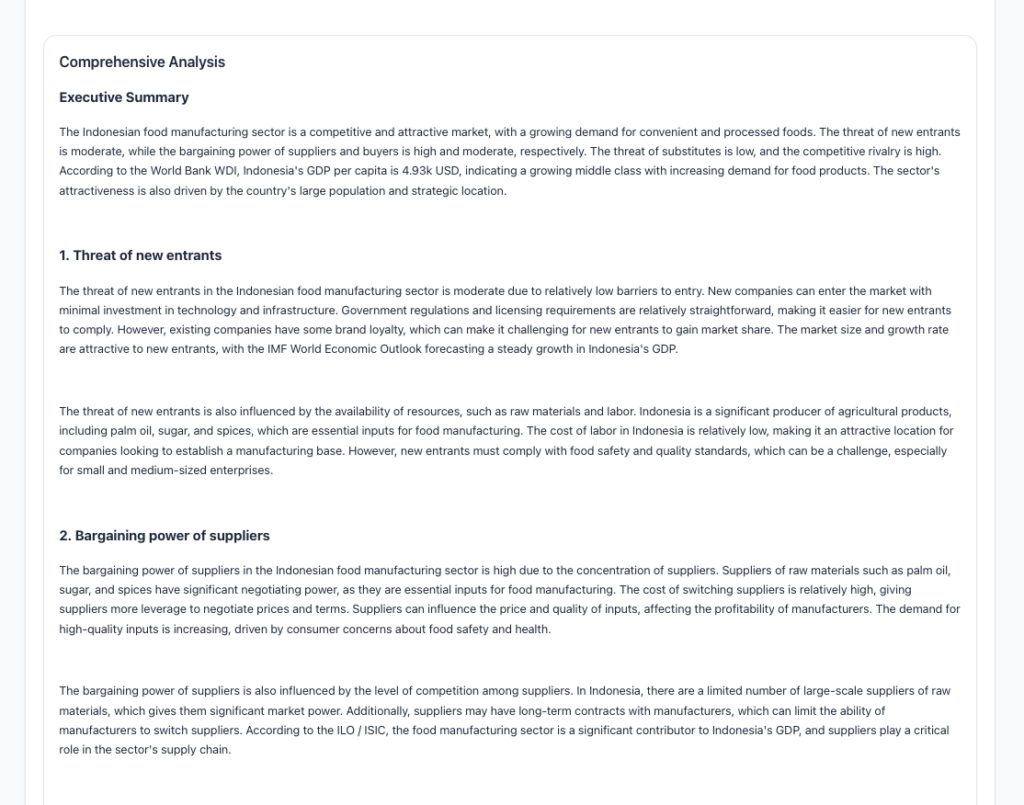
Porter 5 Forces
The Porter’s Five Forces feature brings Michael Porter’s influential framework to life, helping users evaluate market attractiveness through five analytical lenses: the threat of new entrants, bargaining power of suppliers, bargaining power of buyers, threat of substitutes, and competitive rivalry. Designed for country-level analysis, it automatically calculates and visualizes each force using relevant data such as GDP, population distributions, education levels, and industry statistics from IMF, WHO, and World Bank sources. Results are displayed through interactive gauges, bar charts, and heatmaps for intuitive interpretation.
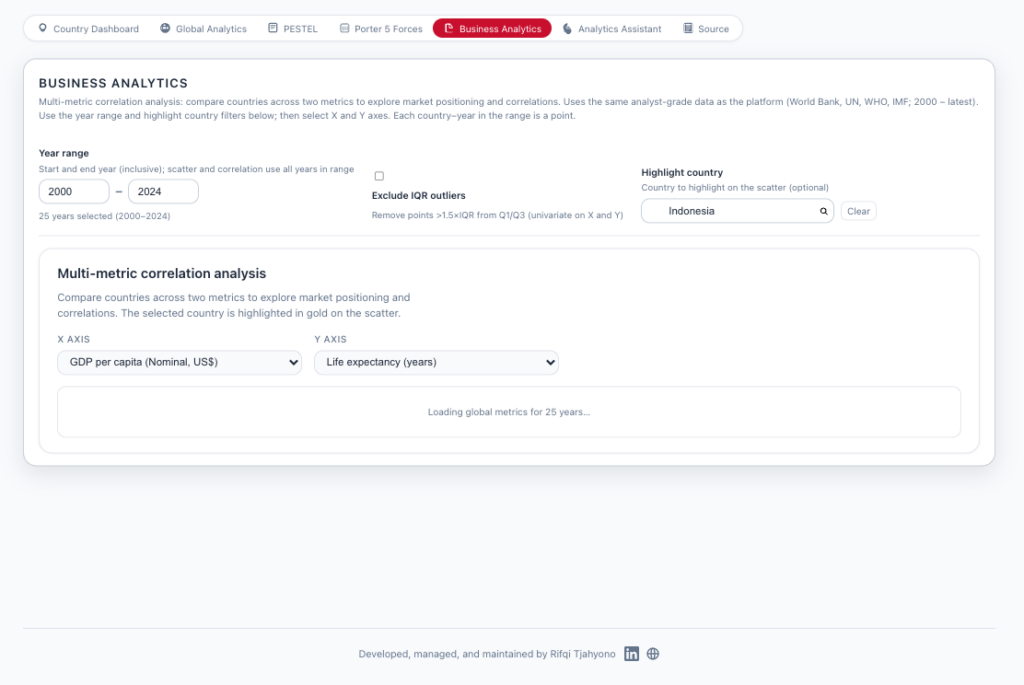
Business Analytics
The Business Analytics feature provides a comprehensive environment for deriving actionable commercial insights from global datasets. Using metrics such as GDP growth, population composition, education levels, and sector-specific indicators from the IMF, World Bank, and WHO, it supports advanced analysis through regression models, cohort comparisons, and growth forecasts. The results are presented in KPI dashboards, trend visualizations, and scenario simulators, allowing product managers and strategists to quantify market potential and assess business opportunities effectively.
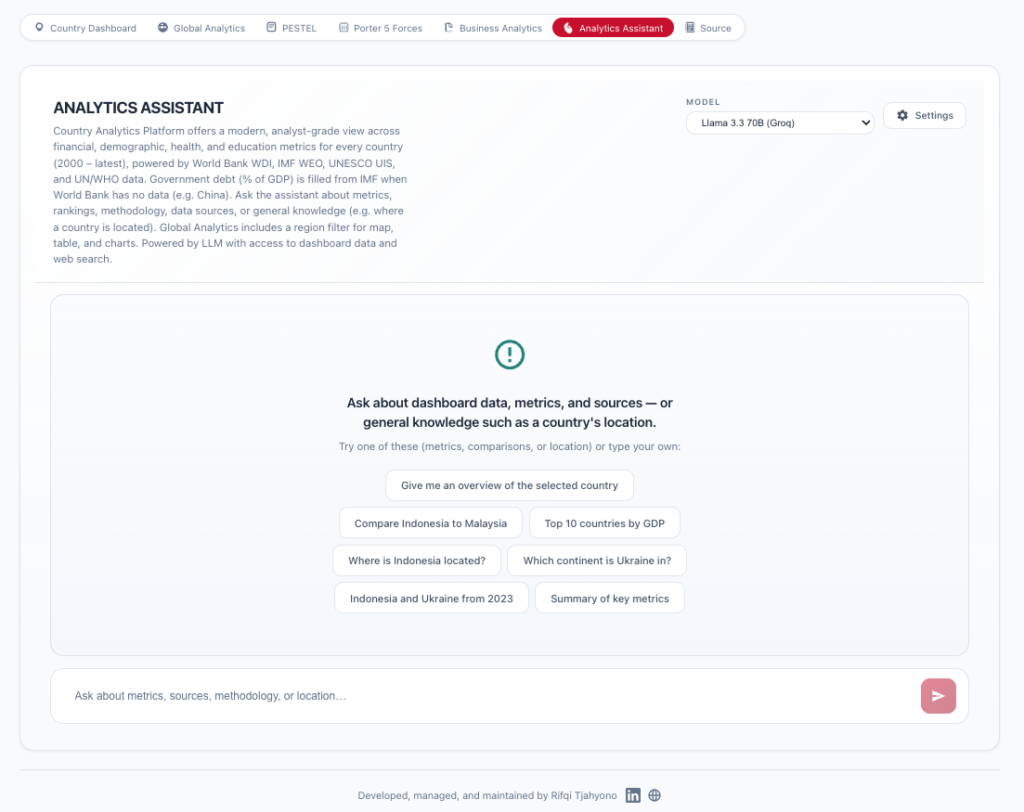
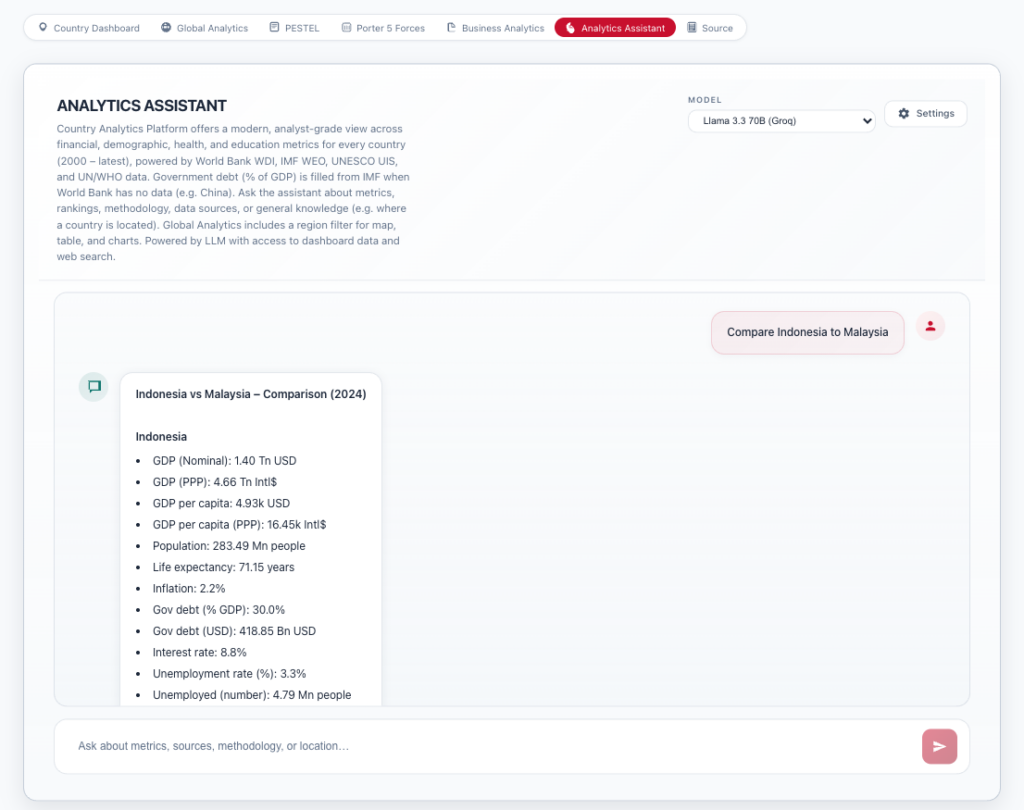
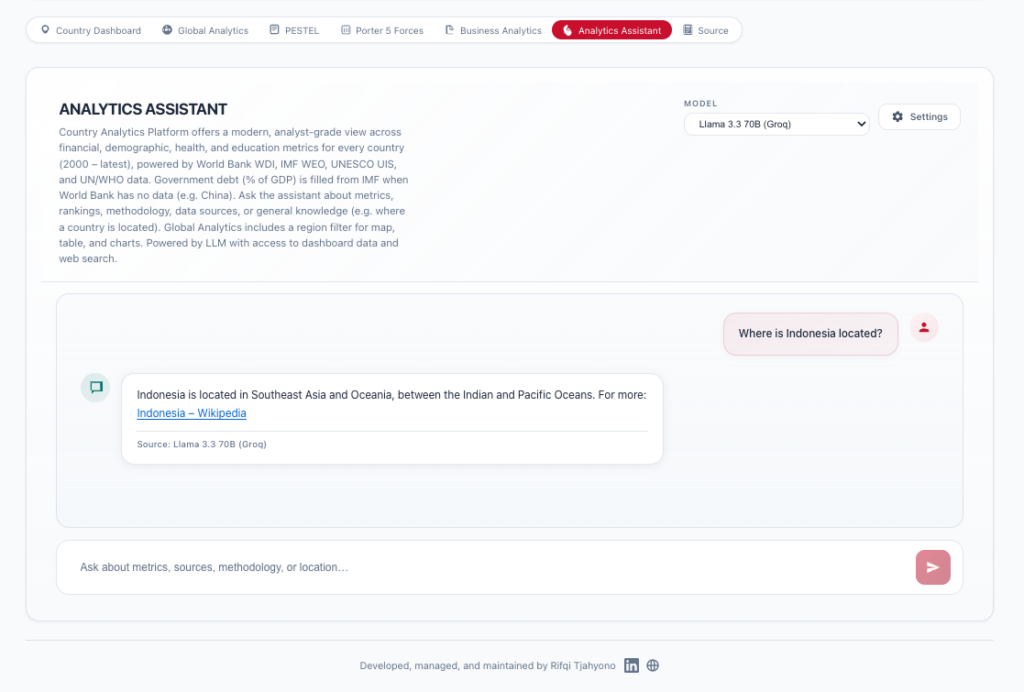
Analytics Assistant
The Analytics Assistant acts as an AI-powered conversational partner, turning complex country datasets into accessible insights. Leveraging large language model (LLM) technology, it allows users to query in natural language about economic, demographic, and educational metrics or to compare countries and regions based on WHO, IMF, and World Bank data. The assistant responds instantly with visualizations, correlations, and narrative summaries tailored to each query.
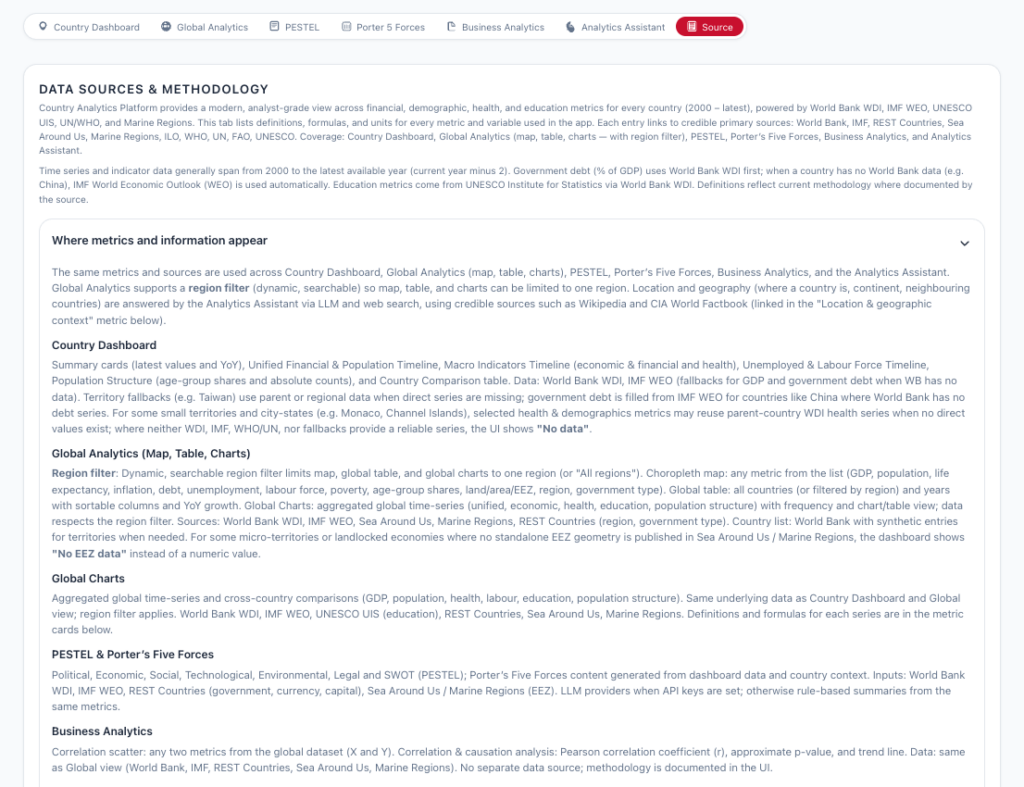
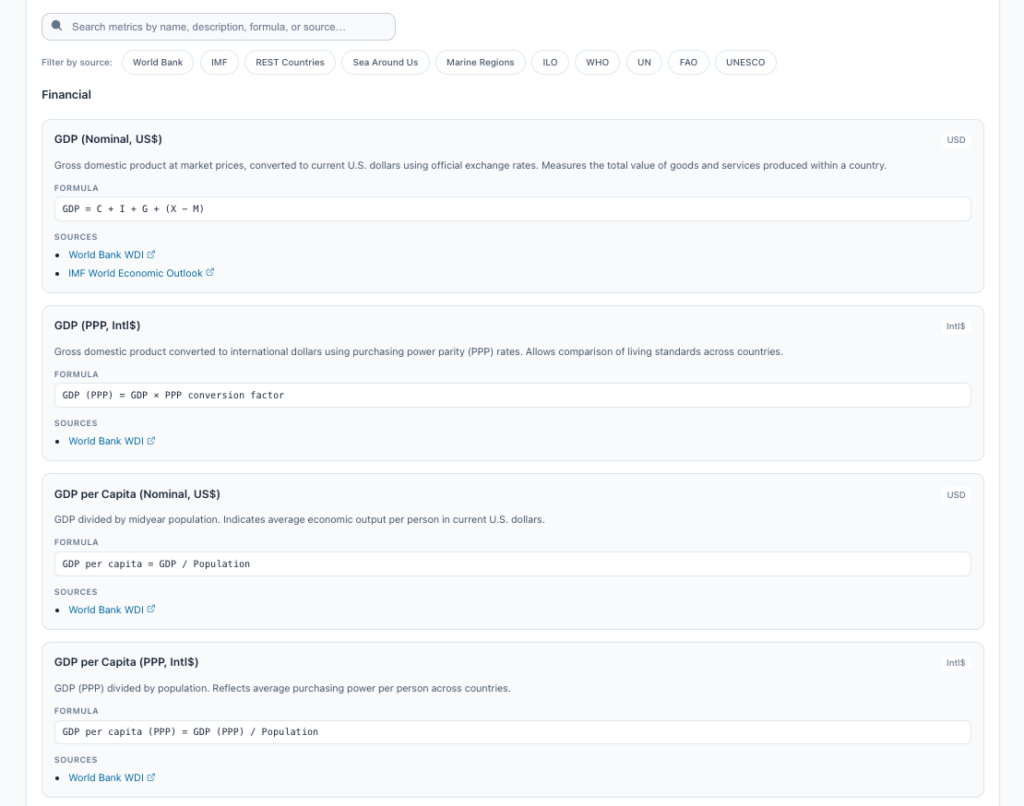
Source
The Source feature ensures complete transparency across all data used in the platform. It catalogues and displays the origin, methodology, and refresh frequency for each metric, including GDP, population demographics, education levels, and health indicators. Credible providers such as the WHO, IMF, World Bank, UN, and national bureaus are listed with direct links, update timestamps, and data quality ratings, establishing trust and reliability for every analysis.
Documentation and Sources
The Country Analytics Platform is thoroughly documented in its GitHub repository, which provides complete references to the logic, data sources, and codebase.
Product Documents
The documentation in the personal GitHub repository covers several key areas of the platform
Architecture
This document outlines the data flow, component boundaries, and technical architecture of the Country Analytics Platform. It aligns with the Product Documentation Standard and supports engineering onboarding as well as feature-to-code mapping. It complements the tech stack and guidelines described in the README and PRD, using professional wording for clarity and easy reference.
View Architecture Documentation →
Product Metrics & OKRs
This document defines how the Country Analytics Platform measures success and how those metrics align with both product and engineering goals. It follows the Product Documentation Standard and covers engagement indicators, feature-level metrics, and OKR alignment. For application data metrics such as GDP, population, or health, see PRODUCT_METRICS.md. For all variables across data, configuration, and environment files, refer to VARIABLES.md.
View Metrics and OKRs Documentation →
Product Requirements Document (PRD)
The PRD serves as the single source of truth for all product requirements. It includes the product overview, problem statements, goals, scope, and detailed feature descriptions for modules such as the Country Dashboard, Global Analytics, PESTEL, Porter’s Five Forces, and the Analytics Assistant. It also covers data rules, non-functional requirements, and business and technical guidelines.
View PRD →
Products Documentation Standard
This document defines the professional documentation standards followed across the project. Every file must include sections such as product overview, benefits, features, logic, business and technical guidelines, and tech stack details. The goal is to maintain consistency, alignment, and a single source of truth for all teams.
View Documentation Standard →
Product Metrics Documentation
This resource provides a comprehensive reference for all data metrics in the Country Analytics Platform. It explains how metrics feed the user interface, outlines metric categories, and defines indicator details including IDs, labels, units, formulas, fallbacks, and World Bank codes. It also defines data quality rules to support product, design, and engineering consistency.
View Product Metrics Documentation →
User Personas
This document describes the platform’s target users, outlining their roles, goals, pain points, success metrics, and typical product interactions. It guides feature prioritization and informs user stories in USER_STORIES.md. Each persona reflects product benefits such as fast insights, credible data, and AI-assisted analysis powered by TAVILY and GROQ and other LLMs.
View User Personas →
User Stories
User stories are grouped by feature area and mapped to the personas defined in the user documentation. Each story includes clear acceptance criteria and follows the Product Documentation Standard to ensure that product logic, behavior, and testability remain consistent across teams.
View User Stories →
Variables Documentation
This document serves as the single reference for all variables used in the platform. It lists each variable’s name, friendly name, definition, formula, and in-app location, along with practical examples. It also describes how variables relate to one another and how data flows from source to interface, helping maintain clarity across product, design, and engineering teams.
View Variables Documentation →
Tech Stacks
The Country Analytics Platform is built on a modern and robust technology stack designed to deliver interactivity, scalability, and intelligent analytics.
- HTML provides the structural foundation for the web interface, ensuring accessibility, SEO readiness, and seamless integration with React components.
- React.js forms the core of the frontend, enabling dynamic user interfaces and handling components such as dashboards, charts, and filters within the Country Analytics Dashboard.
- Tailwind CSS provides utility-first styling for rapid, responsive design across maps, tables, and visual components.
- Plotly.js or Chart.js powers interactive visualizations, including country maps, trend lines, and framework radars like PESTEL gauges.
- Node.js with Express.js manages the backend infrastructure, integrating APIs from data sources such as the World Bank and IMF.
- Python (using Streamlit or Flask) processes data pipelines and supports Large Language Model (LLM) features for the Analytics Assistant.
- MongoDB or PostgreSQL stores cached datasets and user session data, ensuring fast queries and efficient performance.
- LLMs (using APIs from OpenAI, Claude, or local Llama models) drive the Analytics Assistant, enabling natural language interaction and insight generation.
- GROQ serves as the primary LLM engine for analytical reasoning, structured insights, and generating strategic narratives within the Assistant.
- TAVILY provides real-time web retrieval for current data, enhancing LLM responses with the latest global reports, metrics, and news.
- Cursor AI served as the development environment, providing AI-assisted coding, debugging, and feature prototyping for the platform’s interactive analytics.
- APIs from REST Countries, World Bank, and OpenAI enable real-time data connections and enhance the intelligence layer of the platform.
- GitHub is used for version control, collaboration, pull requests, and hosting of technical documentation and READMEs.
Use Cases
The Country Analytics Platform is built on the goals to cover several use cases / scenarios such as
Metric-scoped comparisons
Story: As a researcher, I want metric-scoped comparison views so I can benchmark countries on requested indicators.
Acceptance criteria:
- Sorting works reliably and produces stable ordering.
- Comparison/ranking views are driven by metric IDs from the metric catalog.
- Values render in unit-correct format, including missingness handling (no implicit “zero”).
Scope fidelity for metric questions
Story: As a strategy user, I want assistant responses to stay within the requested metric scope so I can trust scope fidelity.
Acceptance criteria:
- Drift detection triggers fallback when the reply risks leaving the approved metric scope.
- For metric-scoped intents, replies are anchored to platform evidence using deterministic comparison/ranking outputs where applicable.
Web grounding for time-sensitive questions
Story: As a user, I want time-sensitive/current-event questions to be grounded in verified live web evidence when needed.
Acceptance criteria:
- If web context is too thin, the response uses fallback behavior and avoids unsupported assertions.
- Verified-web deterministic path activates for eligible time-sensitive questions when web evidence is required.
- Web evidence is cited and treated as excerpt text supporting specific claims.
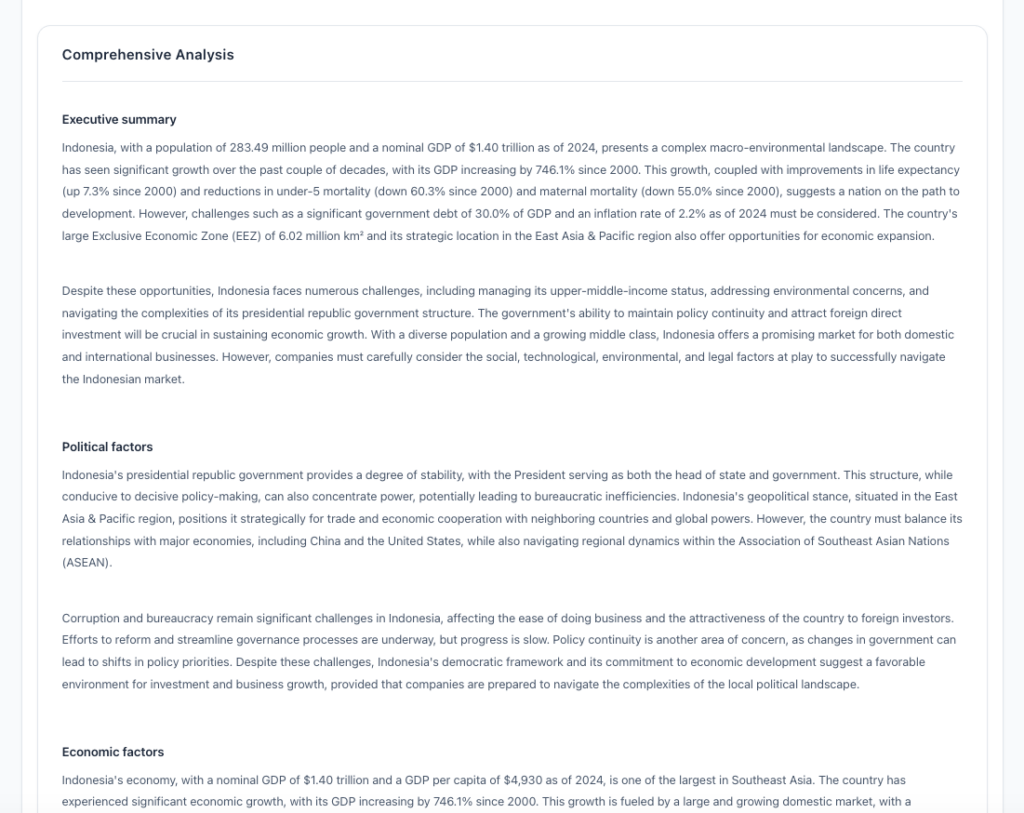
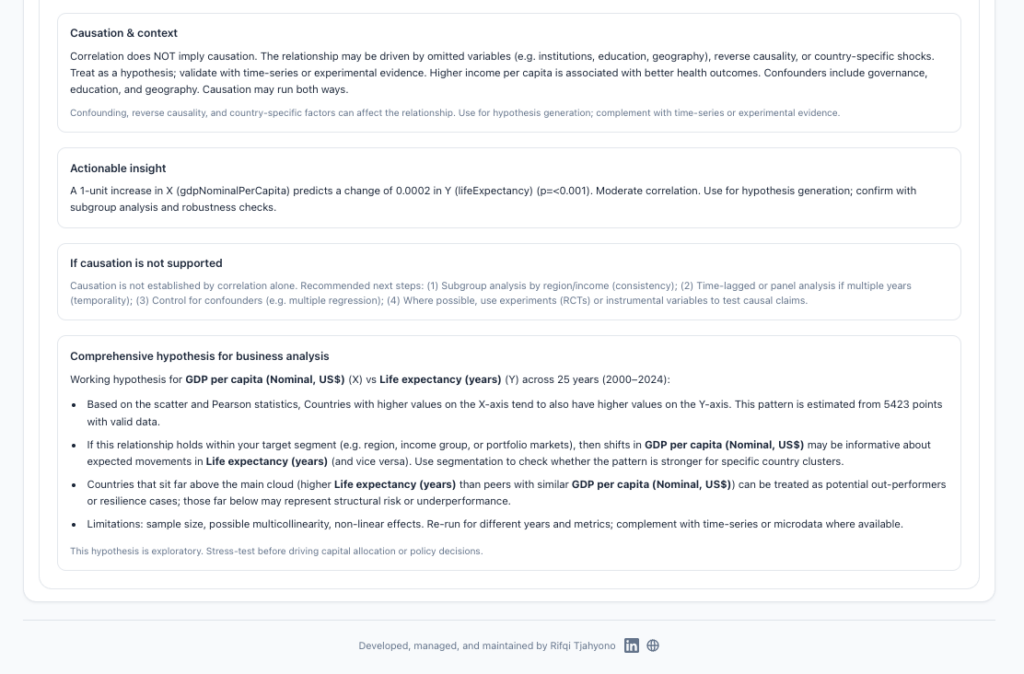
Coherent PESTEL and Porter narratives
Story: As a manager, I want coherent PESTEL/Porter narratives so I can use them in planning meetings.
Acceptance criteria:
- The UI renders the narrative even when AI generation is not available (data-only scaffold fallback).
- Output is structured into stable sections suitable for stakeholder review.
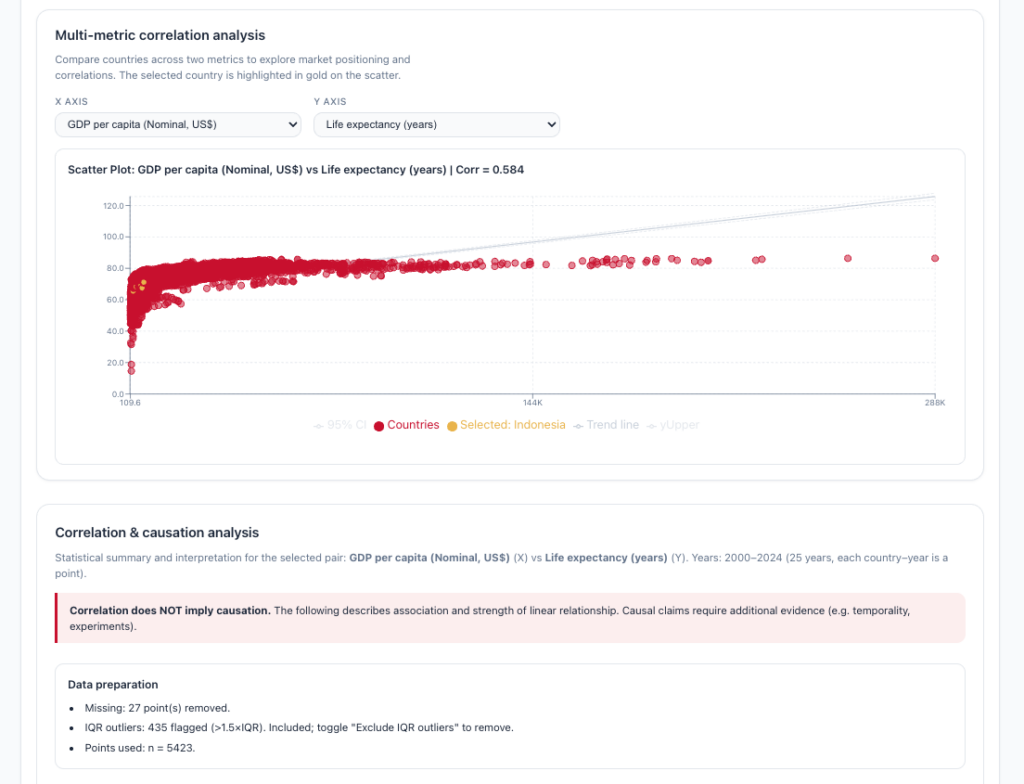
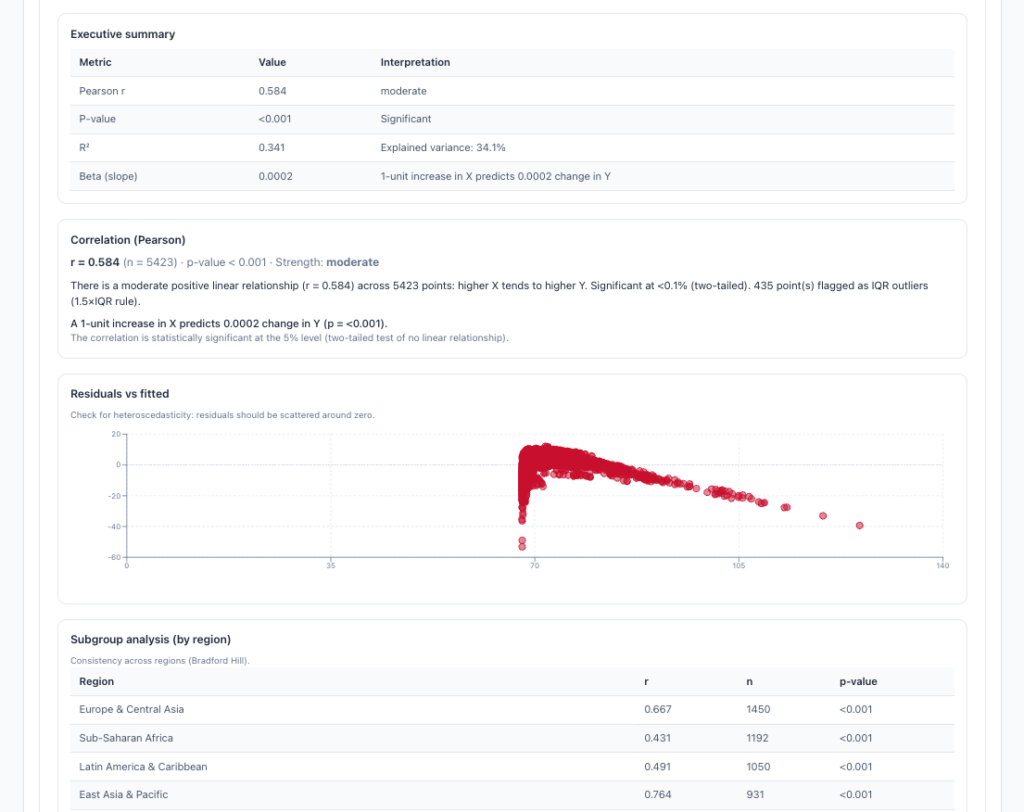
Correlation diagnostics and relative interpretation
Story: As an analyst, I want variable-focused correlation analysis and relative comparison so I can interpret risks and opportunities using consistent statistics.
Acceptance criteria:
- The UI clearly labels correlation as correlation (not causation).
- The module computes and displays Pearson correlation
r, p-value approximation,r²proxy, regression slope/intercept, and residual-based diagnostics. - Optional IQR outlier exclusion is applied and reflected in results.
Why I Built the App
The idea to build these apps was inspired by my long-standing curiosity about how different countries function across economic, social, and technological dimensions. During my university studies and career, I often analyzed markets through frameworks such as PESTEL and Porter’s Five Forces to understand how external factors shape industries and national developments. This habit of exploring countries from a macro perspective in areas like economy, education, healthcare, and finance gradually evolved into the concept of an analytical tool that could simplify such explorations.
My deep interest in data, analytics, and emerging technologies, particularly AI, strengthened the motivation to create these applications. I wanted to combine structured business analysis with practical digital tools that could transform complex market assessments into accessible insights. The project reflects my passion for blending technology with economic curiosity, enabling users to better grasp global market dynamics without relying on time-consuming manual processes.
What I Learnt from the App Development
Developing the Country Analytics Sidekick felt like turning myself into a one-person market research factory with zero interns and endless curiosity about new countries. I kept picking obscure markets like “Indonesia for fintech” only to drown in outdated spreadsheets and half-baked Google searches that promised insights but delivered confusion. The real wake-up call came when my own sloppy inputs led to ridiculous outputs, like rating a stable democracy as high-risk because I fat-fingered the data prompt. That forced me to build in validation checks and simple UX tweaks, proving that even solo projects demand treating yourself as the pickiest client alive, or the tool becomes just another digital dust collector.
Chasing “AI magic” for PESTEL and Porter’s frameworks quickly revealed the comedy of overpromising prompts that spat out generic fluff instead of tailored analysis. I learned the hard way that without tight scoping, the app ballooned into a feature Frankenstein, complete with half-implemented charts and forgotten error handling that crashed on real-world edge cases like tiny island nations. True scalability emerged only when I ruthlessly prioritized core pain points like quick country comparisons over shiny extras, turning a chaotic prototype into an organized powerhouse that actually saved hours on market entry homework.
AI agents proved invaluable for rapid prototyping, from code generation to API setups, accelerating development like a dedicated team member. However, my foundations in product management, analytics, technical skills, UX design, and engineering were essential in defining data models, user flows, and architecture to address core pain points in market analysis, not just for me but potentially for others. Ultimately, AI handles execution speed, while professional craft ensures relevance, organization, and lasting value.