

Background Story
I used to believe Excel could handle anything. Budgets, roadmaps, even tracking my working hours all ended up in one file. It worked well at first, until I noticed I was spending more time fixing the spreadsheet than actually working. My simple tracker slowly turned into a maze of tabs, color codes, and formulas that only made sense at midnight. One mistaken copy-paste and my weekly hours could suddenly suggest I had worked through three weekends in a row. Before long, it became a weekly ritual filled with coffee, confusion, and quiet reflection on how time seems to disappear faster in Excel than in real life.
Anyone who has tried to track working hours manually in Excel will probably recognize these hidden challenges. They start small but quickly grow into something that demands more energy than it should.
Those hidden challenges did not stay abstract for long. They revealed themselves through five specific pain points that turned a simple task into a daily drain on focus and sanity. Each one builds on the last, proving why manual tracking in Excel feels less like productivity and more like an unintended endurance test.
Error-Prone Calculations
Manual spreadsheets rely heavily on formulas, references, and user input, which means accuracy is fragile. A single misplaced cell or a small typo in a formula can distort total work hours or overtime calculations in ways that are hard to notice until much later. These tiny errors often accumulate across weeks or months, creating inconsistencies that are difficult to trace. The result is a growing sense of doubt about whether the numbers truly reflect reality.
Time-Consuming Maintenance
What begins as a simple tracking sheet gradually transforms into a recurring task that steals time from actual work. Professionals often find themselves adding rows, adjusting date formats, or copying formulas across tabs every week. Visual updates such as color coding or sorting data by project type also take additional effort. Instead of supporting productivity, the spreadsheet becomes another system to maintain for the regular or daily usage, especially when deadlines are tight.
Lack of Real-Time Insights
Spreadsheets store data but do not interpret it. To understand trends such as daily performance or workload balance, users must manually create pivot tables or charts each time. This process lacks flexibility because spreadsheets do not automatically visualize or update information in a meaningful way. As a result, professionals spend more time analyzing static data than drawing insights that could help them work more efficiently.
No Clear View of Productivity
Excel can record how many hours you spend working, but it rarely reveals the full story behind those numbers. Without clear summaries or visual insights, it becomes difficult to identify patterns such as when you are most productive, where distractions occur, or how your focus shifts throughout the day. The data stays flat, showing only totals rather than meaningful trends. As a result, improving time management or finding a balanced workflow becomes guesswork instead of a guided, reflective process.
Poor Scalability and Context Awareness
As data volume grows, Excel tends to slow down and lose its intuitive edge. Large logs make formulas more prone to breaking, and the file becomes cumbersome to load or share. Beyond performance, manual tracking also lacks contextual insight. It shows when time was spent but not why it was spent that way. It cannot reveal patterns such as the difference between productive focus hours and reactive meeting time, making it difficult to connect time investment with personal or business outcomes.
Now imagine a better scenario. You begin your week with clarity, not another spreadsheet staring back at you. No more guessing where your time went between meetings, focus sessions, and “quick” tasks that somehow filled your afternoon. The Working Hours Tracker quietly keeps things organized while you focus on the work itself. It records your hours, arranges them neatly, and helps you see patterns that genuinely matter. Instead of fighting numbers, you finally gain insights that make you work smarter, not longer.
That is what inspired me to create it. After too many weeks of second-guessing spreadsheets, I wanted something that truly supported my work routine. The Working Hours Tracker is built to be simple and steady, a tool you can rely on without thinking about it. It helps transform routine logging into a moment of reflection, showing where your time and energy go. It is not about tracking every minute, but about understanding your flow and using that knowledge to plan, prioritize, and live your professional rhythm with confidence.
Product Definition
Say hello to the Working Hours Tracker, a personal project I built to turn daily time tracking from a messy spreadsheet routine into a clear and reflective experience. This simple yet purposeful tool helps professionals capture their working hours accurately and visualize how their time is truly spent. It removes the tedious parts of logging and calculating so you can focus more on productive work and less on formula fixing.
The application is a personal productivity companion designed to bring structure and clarity to your workday. It allows you to track your hours, monitor focus patterns, and gain valuable insights about how you spend your time. Instead of scrolling through endless rows in Excel, the Working Hours Tracker presents your data in an organized and intuitive way that is easy to review at a glance. Whether you are balancing projects, managing your workload, or aiming to improve your daily flow, it gives you a clear view of how time moves throughout your day.
By simplifying tracking and reflection, the app saves you from the repetitive, manual work of maintaining spreadsheets. It helps you understand where your hours go, what type of tasks consume the most energy, and when you are at your most productive. With that awareness, you can plan smarter, avoid burnout, and build a rhythm that supports long-term focus. The goal is simple: make time tracking effortless so that you can spend your hours on the things that matter most.
You can check the platform through the following link here
Product Benefits
The Working Hours Tracker offers a set of practical benefits that make managing your time simpler, more transparent, and easier to understand.
- Quick insights: Instantly view your daily, weekly, or monthly summaries to spot time patterns and understand how your focus shifts throughout the week.
- Accurate tracking: Built for reliability and simplicity, the tracker automatically calculates total hours without the risk of broken formulas or incorrect references.
- Intuitive user experience: Features a clean layout with time input fields, daily logs, and visual overviews that make tracking feel natural rather than tedious.
- Clear and transparent design: Each metric and calculation is easy to follow so you always understand how your working hours are recorded and summarized.
- Self-reflective insights: Helps you recognize your peak productivity periods, recurring habits, and areas where time might be slipping away, allowing smarter planning and adjustment.
- Export-ready summaries: Generate clean copies of your time data that can be used for performance reviews, project reporting, or personal tracking.
- Lightweight and accessible: No log-in required and no complex setup. The app runs locally, providing instant access without needing an internet connection.
Core Value Proposition
The Working Hours Tracker provides a clear and unified interface designed to make recording, reviewing, and understanding your working hours simple and meaningful.
- Record: Log your daily working hours quickly and accurately to capture how your time is truly spent across tasks, meetings, and projects.
- Review: Explore your tracked data through weekly and monthly summaries that help you identify where your focus goes and how your work patterns evolve over time.
- Reflect: Gain clarity through organized visualizations that show when you are most productive, where distractions occur, and how balance shifts throughout the week.
- Adjust: Use the insights to plan smarter, set realistic schedules, and avoid overworking. The tracker supports reflection as part of continuous improvement rather than strict monitoring.
- Visualize: View your data through clear, interactive charts that make patterns immediately visible, helping you turn numbers into understanding.
- Simplify: Eliminate the manual effort of managing Excel formulas or multiple tabs. Everything is structured automatically, allowing you to focus on meaningful work.
- Export: Download tidy, ready-to-share summaries for personal reflection, productivity reviews, or project documentation with just a few clicks.
Target Audience
The Working Hours Tracker is built for professionals who care about how they spend their time, offering simple, transparent insights that help you understand your work rhythm, reflect on your habits, and make small, thoughtful adjustments that add up over time.
| Audience | Use Case |
|---|---|
| Freelancers and independent consultants | Track daily hours per client or project to stay disciplined with invoices and avoid under‑ or over‑billing, without juggling spreadsheets. |
| Students and self‑learners | Monitor study or practice sessions over days or weeks, helping them stay disciplined and recognize patterns in their learning habits. |
| Remote or hybrid knowledge workers | Log working hours consistently across time zones and days off, helping them maintain healthy boundaries and avoid burnout. |
| Developers and makers building side projects | Keep a lightweight record of time invested in experiments or personal tools, turning scattered effort into measurable progress and reflection. |
| Professionals preparing for career decisions | Use tracked data and summaries to reflect on work patterns, identify over‑committed periods, and support conversations around promotions, role changes, or career pivots. |
Key Features
The Working Hours Tracker is designed and developed around several key features that together make tracking, reviewing, and reflecting on your working hours simple, intuitive, and genuinely useful.
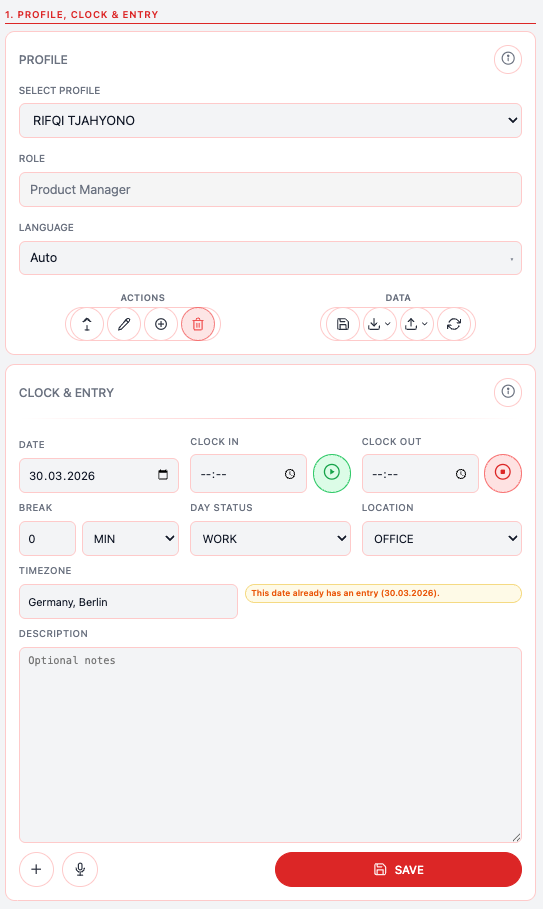
Profile, Clock, and Entry
The app’s Profile, Clock, and Entry layer centers around personalization and efficient time logging. It supports multi‑profile selection and role display, letting you switch between different work identities or contexts (for example, client‑based roles, internal projects, or side‑hustle identities) while keeping those distinctions visible at a glance. This makes it easier to track how your hours are distributed across different responsibilities.
For active logging, the interface offers quick clock‑in and clock‑out shortcuts so you can start and end work sessions with minimal navigation. The app also supports single‑entry and multi‑entry (bulk) input flows, enabling you to either record individual work blocks individually or enter several time entries in one go, such as retroactively filling in a day or a week.
To streamline the process even further, it integrates voice‑assisted entry parsing and review, allowing you to speak or dictate your entries and then verify them visually before committing. Additionally, the system uses automatic timezone detection, first pulling the timezone from the user’s browser and falling back to IP‑based estimation when needed, so timestamps remain consistent and accurate regardless of location or travel.
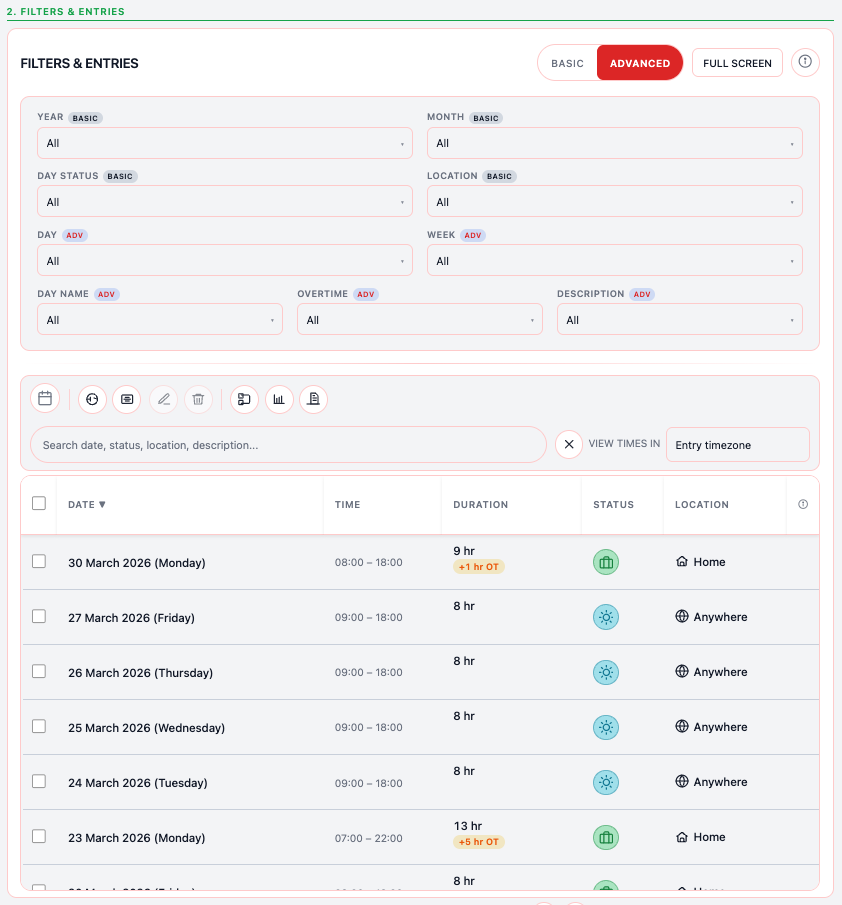
Filters and Entries
The Filters and Entries layer gives you fine‑grained control over how you view and manage your logged work. It exposes basic and advanced filters with mode toggles, letting you quickly narrow down entries based on whichever criteria matter most at that moment. You can filter by date, week, month, day‑name, status, location, overtime eligibility, and task or description content, turning raw logs into targeted views that support analysis, invoicing, or reflection.
Filter options are organized with smart‑select filter ordering that preserves natural sequences: for example, options flow from All → Month (Jan through Dec), All → Weekday (Mon through Sun), All → Day (1 through 31), and All → Week (1 through 53), aligning with how people naturally think about time.
Work logs are displayed in a sortable entries table with a timezone‑aware display option, so you can reorder entries by date, duration, or status and still trust that the times are shown in the correct local context. The table supports row selection, batch edit and delete operations, and a fullscreen entries mode, which provides a larger, distraction‑free workspace for review, cleanup, or detailed analysis.
Calendar and Statistics
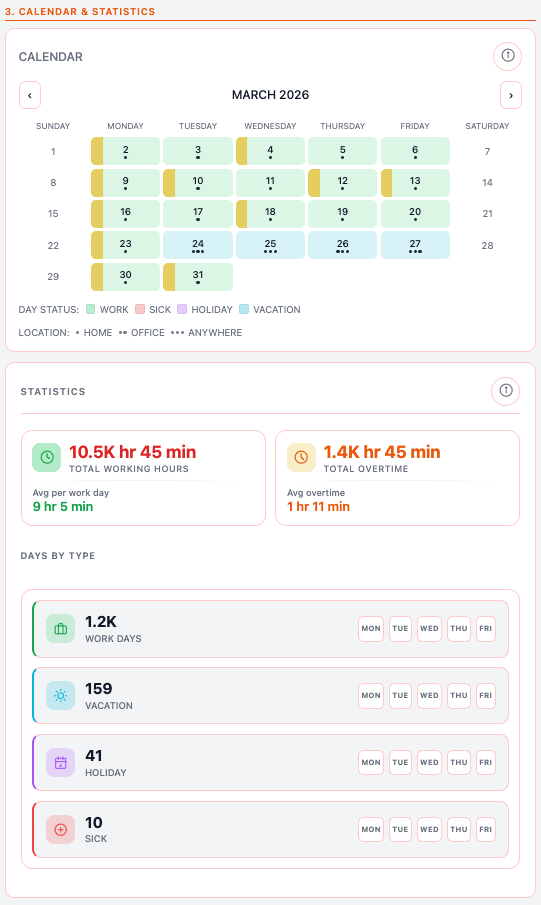
The Calendar and Statistics components translate your raw time data into visual patterns and high‑level metrics. The app includes a calendar heat‑style status visualization, where intensity‑coded cells highlight how busy or light each day has been, helping you spot workload peaks, quiet periods, and recurring patterns at a glance.
Statistical summaries are presented as statistics cards that show totals, averages, and counts of days by type, such as billable versus non‑billable days or focused work versus meeting‑heavy days. These cards are enhanced with structured modern tooltips that group information clearly into title, location block, weekday block, and indented detail lines, so you can inspect granular information without leaving the overview.
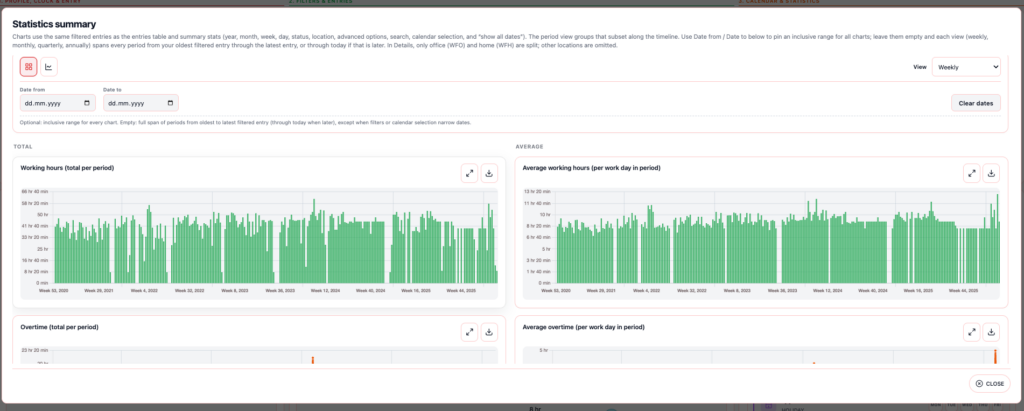
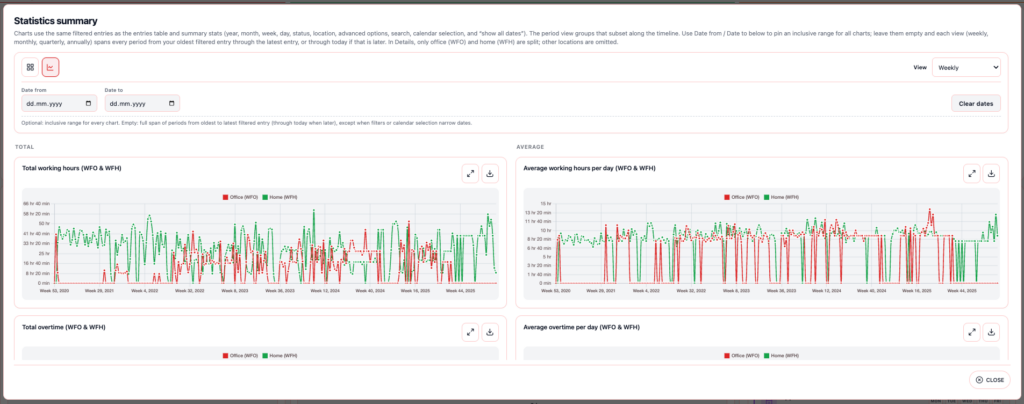
Specialized dedicated average‑subsection tooltips in the Total Working Hours and Total Overtime cards break down averages by weekday and location, giving you deeper insight into how different days and venues impact your time. The app further exposes a Statistics Summary modal with chart views that can be enlarged or opened in fullscreen mode, letting you zoom into trends and trajectories.
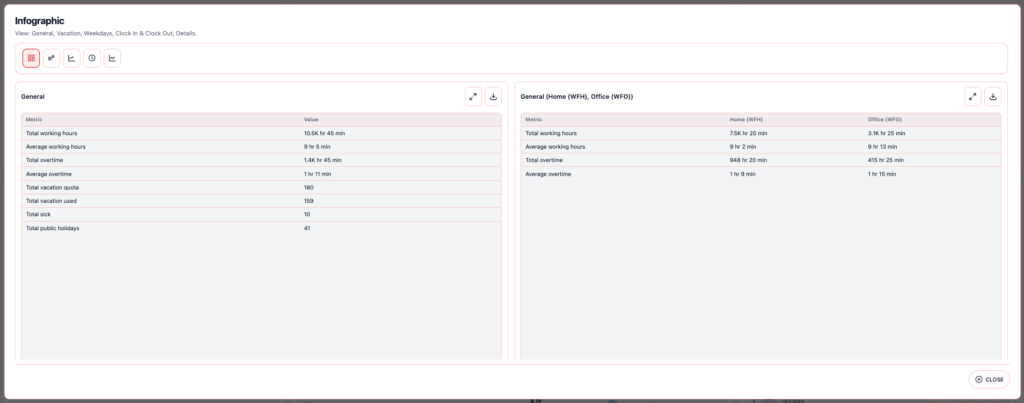
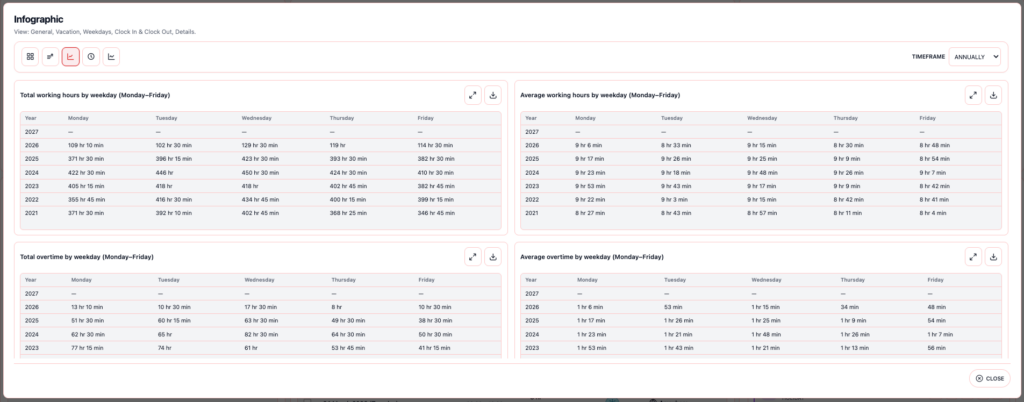
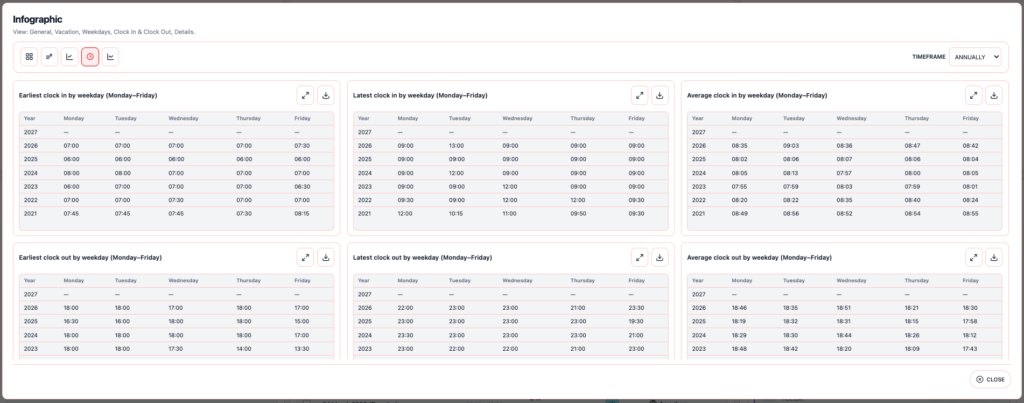
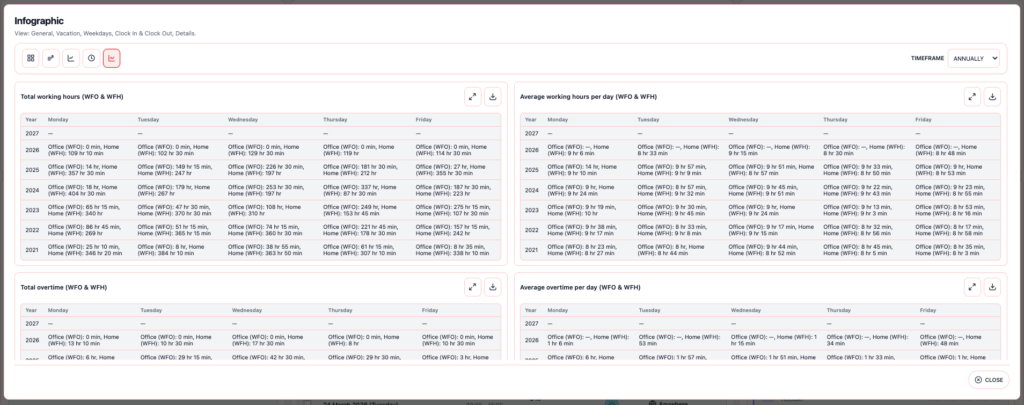
An Infographic modal complements this with category clusters and table‑level fullscreen navigation, enabling you to explore structured groupings of your time use (for example, by project, client, or activity type) in a more visual and intuitive way.
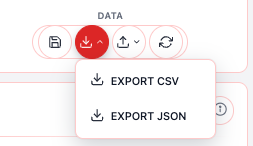
Data and Reporting
The Data and Reporting features focus on portability, analysis, and communication of your time insights. The app exposes JSON sync and merge APIs, allowing you to programmatically export your logs, combine datasets from multiple periods or devices, or integrate them into external tools or pipelines.
For traditional analysis, it offers CSV export for tabular analysis, enabling you to load your tracked hours into spreadsheets, BI tools, or statistical environments for deeper exploration.
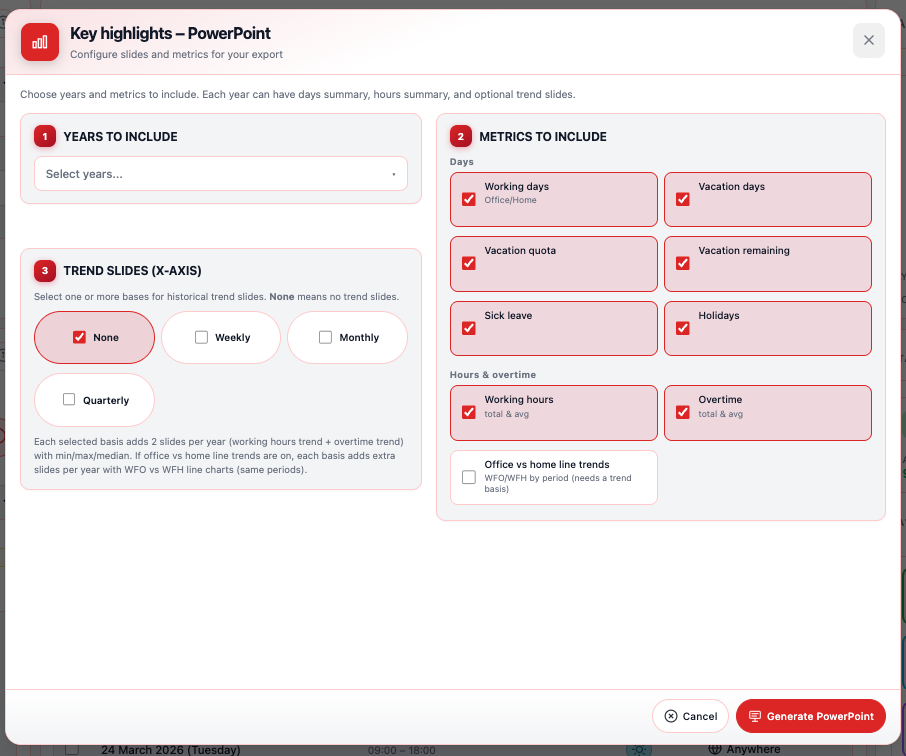
To support executive or stakeholder updates, the app includes PowerPoint key highlights generation for executive updates, where it auto‑generates slide‑ready content that distills your most important time‑based insights. The PPT generator modal reuses the same dynamic size envelope as the Statistics Summary and Infographic modals, ensuring consistent layout and responsiveness whether you are working in a small window or a full‑screen view.
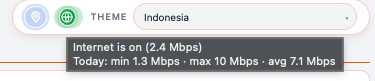
Connectivity and Runtime Context
The Connectivity and Runtime Context layer enhances reliability and awareness of your environment. The app displays an internet status indicator that shows the live connectivity state and, when available, an estimated downlink speed in megabits per second, so you can quickly understand your network quality while working.
In the background, it tracks daily speed analytics per local calendar day, capturing minimum, maximum, and average bandwidth, and surfaces this in subtle tooltip contexts without disrupting your core workflows. This additional layer of telemetry helps you correlate performance and experience with network conditions while keeping your primary time‑tracking flows clean and focused.
Multilingual Interface and Language Translations
The Language and Translation layer makes the Working Hours Tracker more accessible to users who prefer different languages. Core interface elements such as labels, buttons, and common prompts are maintained in separate language catalogs, allowing the app to render its UI in multiple languages without changing how logging or editing works. This helps professionals who think and work in their native language stay comfortable while using the tracker day after day.
The app is built with an internationalization‑ready pattern, so language switching follows a consistent flow. Users can typically select their preferred language from a simple selector, and the interface updates all visible text accordingly while keeping data, layout, and behavior unchanged. Where supported, the app can also detect the browser or system language and default to that locale, reducing manual setup for users who expect their tools to feel familiar out of the box.
All translations are stored in structured message files or resource bundles, making it easier to add new languages gradually or refine existing wording over time. This design keeps the codebase clean and ensures that any changes to language strings stay isolated from the underlying logic. By supporting clear, maintainable translations, the app stays focused on helping individuals track their time in a way that feels both familiar and intuitive, regardless of the language they work in.
Voice-based Inputs
The Voice‑based Input layer makes the Working Hours Tracker feel more natural and accessible for users who prefer speaking over typing. Instead of manually filling forms or editing entries, you can describe your work blocks using simple spoken phrases, such as “started at 9 AM” or “worked on design review from 2 to 4 PM.” The app parses these inputs into structured time entries, preserving the core logic of logging hours while removing friction around manual typing. This is especially helpful for professionals who are in the flow of work and want to capture time without leaving their current context.
The implementation is built around a clear, consistent pattern of voice‑assisted entry that keeps data integrity and user control in place. After you speak or dictate your time description, the app shows a preview of the parsed start time, end time, and any detected labels or descriptions, giving you a chance to review and correct them before committing. Voice‑based input is treated as a helper rather than a replacement, so you still see what the system understands and can adjust dates, durations, or tags as needed. This approach balances automation with transparency, ensuring that you stay in control of your recorded hours.
Behind the scenes, the voice‑based logic is kept separate from the core time‑tracking engine, which keeps the codebase organized and easier to maintain. Parsing, normalization, and validation of spoken input are handled in dedicated modules, so adding new phrases, improving recognition patterns, or adapting to different speaking styles can be done incrementally. By supporting voice‑assisted entry, the app moves beyond rigid forms and lets people describe their work in a way that feels conversational, intuitive, and closer to how they naturally talk about their time.
Documentation & Sources
The Working Hours Tracker is thoroughly documented in its GitHub repository, which provides clear explanations of the app’s logic, data structure, and core features as well as links to any relevant references or dependencies.
Product Documents
The documentation in the personal GitHub repository covers several key areas of the platform
Architecture
This document outlines the data flow, component boundaries, and technical architecture of the Working Hours Tracker. It aligns with the Product Documentation Standard and supports engineering onboarding as well as feature-to-code mapping. It complements the tech stack and guidelines described in the README and PRD, using professional wording for clarity and easy reference.
View Architecture Documentation →
Product Metrics & OKRs
This document explains how the Working Hours Tracker measures success and how those metrics are aligned with both product and engineering objectives. It follows the Product Documentation Standard and describes engagement indicators, feature‑level usage, and how these support broader personal productivity goals. For detailed definitions of app‑level metrics such as time‑logging frequency, session length, and reflection patterns, see PRODUCT_METRICS.md. For all variables used across configuration, data, and environment files, refer to VARIABLES.md.
View Metrics and OKRs Documentation →
Product Requirements Document (PRD)
The PRD serves as the single source of truth for all product requirements for the Working Hours Tracker. It includes the product overview, problem statements, goals, scope, and detailed feature descriptions for modules such as Profile, Clock, Entry, Filters, Statistics, and Reporting. It also covers data rules, non‑functional requirements, and business and technical guidelines that shape how the app stores, displays, and processes working hours.
View PRD →
Product Documentation Standard
This document defines the professional documentation standards followed across the Working Hours Tracker project. Every file is expected to include sections such as product overview, benefits, features, logic, business and technical guidelines, and tech stack details. The goal is to maintain consistency, clarity, and a single source of truth for anyone who reads, extends, or contributes to the project.
View Documentation Standard →
Product Metrics Documentation
This resource provides a comprehensive reference for all data metrics used in the Working Hours Tracker. It explains how metrics feed the user interface, outlines metric categories, and defines indicator details such as names, labels, units, and formulas. It also describes data‑quality expectations to support consistent behavior across product, design, and engineering considerations.
View Product Metrics Documentation →
User Personas
This document describes the primary users of the Working Hours Tracker, outlining their roles, goals, pain points, and success metrics when tracking time. It guides feature prioritization and informs user stories in USER_STORIES.md, helping align the app’s behavior with how individuals actually use it. Each persona reflects benefits such as simplicity, clarity, and the ability to reflect on work patterns without over‑engineering.
View User Personas →
User Stories
User stories are grouped by feature area and mapped to the personas defined in the user documentation. Each story includes clear acceptance criteria and follows the Product Documentation Standard to ensure that product logic, behavior, and testability remain consistent and easy to trace. This structure helps keep the app focused on real workflows rather than hypothetical edge cases.
View User Stories →
Variables Documentation
This document serves as the single reference for all variables used in the Working Hours Tracker. It lists each variable’s name, friendly name, definition, formula, and in‑app location, along with practical examples. It also describes how variables relate to one another and how data flows from storage to the interface, helping maintain clarity across product, design, and engineering considerations.
View Variables Documentation →
Tech Stacks
The Working Hours Tracker is built on a focused and lightweight technology stack designed to deliver a simple, stable, and fast experience for personal time tracking.
- HTML provides the structural foundation for the web interface, ensuring accessibility and clean integration with the rest of the frontend.
- JavaScript (or React/Vanilla JS) forms the core of the frontend, handling interactions such as adding entries, editing logs, and displaying summaries.
- CSS or a lightweight utility‑first framework provides styling for a responsive, distraction‑free UI that works well on both desktop and mobile screens.
- Local storage or IndexedDB stores your time logs on the device, preserving data between sessions without relying on external servers.
- GitHub is used for version control, collaboration, and hosting the technical documentation and README, keeping the project transparent and easy to follow
Use Cases
The Working Hours Tracker is built on the goals to cover several use cases / scenarios such as
Create Daily Entry
As an Individual Contributor, I want to add a daily entry with date/time/status/location, so that my workday is properly recorded.
Acceptance Criteria:
- Required fields are validated.
- Entry persists and appears in entries table.
- Statistics refresh immediately after save.
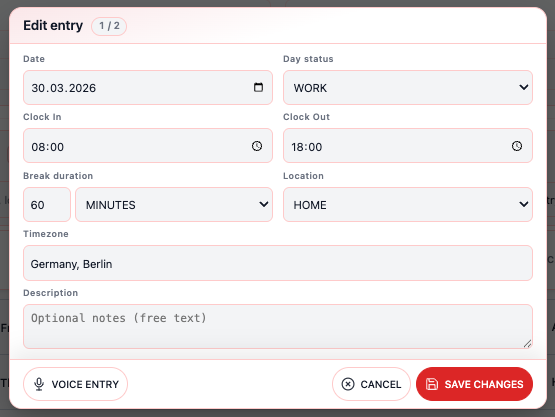
Edit Existing Entry
As an Individual Contributor, I want to edit existing entries, so that corrections are reflected accurately.
Acceptance Criteria:
- Edit modal preloads current data.
- Timezone defaults resolve intelligently for legacy and missing values.
- Updated record is shown with refreshed aggregates.
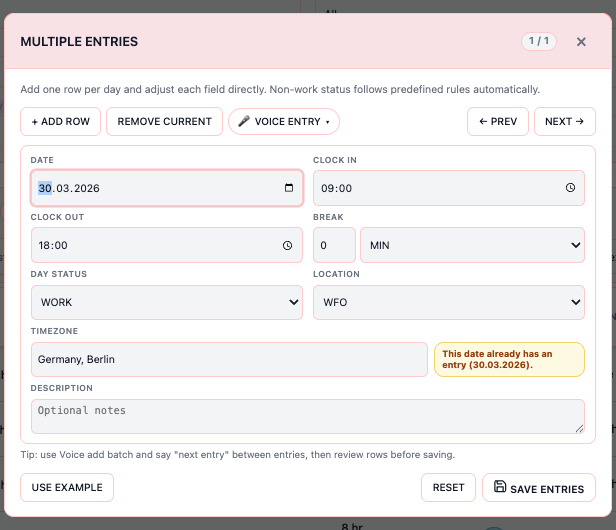
Multi-Entry Input
As an Individual Contributor, I want to submit multiple entries in one flow, so that I can backfill data faster.
Acceptance Criteria:
- Multi-entry form supports sequential or bulk submission.
- Validation feedback identifies invalid rows clearly.
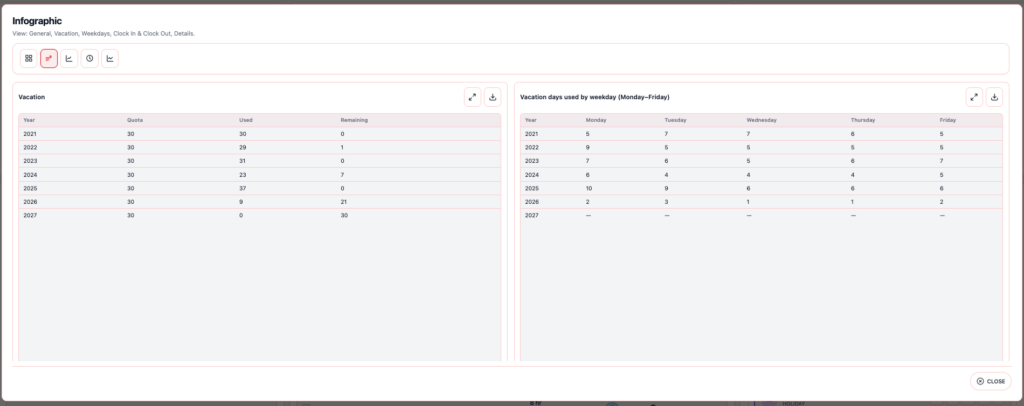
Infographic Timeframe and Period Tables
As an Operations Analyst, I want to change the Infographic timeframe between annual, quarterly, monthly, and weekly views, so that weekday work, overtime, clock, and WFO/WFH detail tables match the reporting period I care about.
Acceptance Criteria:
- Timeframe control offers Annually, Quarterly, Monthly, and Weekly and persists the selection when browser storage is available.
- The timeframe toolbar (label + select) is visible and enabled only on Weekdays, Clock In & Clock Out, and Details clusters; on General and Vacation it is hidden and the select is disabled (stored preference is not cleared when switching away).
- Weekday-centric tables show a Year or Period column consistent with the selection; period labels use localized templates (
infographic.period.*). - Row order lists periods newest first (descending sort of period keys).
- Affected tables are inside a scrollable region with a sticky header when content exceeds the viewport cap.
- CSV export for those sections uses the same period ordering and semantics as the on-screen table.
Export to CSV/JSON/PPT
As an Analyst, I want to export operational and presentation-friendly outputs, so that reporting can be shared externally.
Acceptance Criteria:
- CSV and JSON exports are complete and valid.
- PPT highlights reflect the same source stats and language intent.
Why I Built the App
The idea to build the Working Hours Tracker came from my long‑standing need to understand how time actually flows in a workday, rather than guessing from spreadsheets or memory. Over the years, I’ve thought about work patterns, focus, and balance the way analysts think about markets: observing inputs, outputs, and feedback loops. This habit of reflecting on how time is spent across meetings, deep work, and side projects gradually evolved into the concept of a simple, purpose‑built tool that could make personal time tracking feel intentional and human.
My interest in data, structure, and emerging technologies, particularly in how tools can simplify daily workflows, strengthened the motivation to create this app. I wanted to combine the discipline of tracking with the ease of a lightweight, local‑run experience, so that logging hours feels less like administration and more like a quiet reflection. The Working Hours Tracker reflects my passion for blending technology with honest self‑awareness, helping professionals better understand their own work rhythms without relying on fragile, time‑consuming manual processes.
What I Learnt from the App Development
The most relatable lesson from developing the Working Hours Tracker was that personal projects are basically tiny startups with no budget and only one user you cannot escape. Building this app meant constantly fighting my own habits, rationalizations, and procrastination loops, because if I did not use it consistently then nobody else would either. I learned that the most honest feedback comes from future me a few days later, staring at a messy log and wondering why I thought that flow made sense. That pressure turned every design and feature decision into a small experiment in user empathy, even when the only user was me.
At the same time, this project was a humbling reminder that “simple” is one of the hardest promises to keep in product work. Every time I thought the tracker was minimal and elegant, another idea would pop up, like tracking mood or adding tags and filters, and suddenly the scope would balloon. I learned that the real discipline is not in collecting more data but in saying no to anything that does not solve the core problem, which is understanding how I spend my time. The more I stripped features away, the more useful and honest the tool became, and that taught me how much of product work is about restraint rather than ambition.
Finally, I realized how much AI agents have become my development partners, but also how deeply my foundations in product management, analytics, UX, and engineering still shape the product. AI helped me write code faster, debug tricky cases, and generate boilerplate, but the decisions about what to track, how to structure the data, and how to design an interface that feels light and unobtrusive came from product thinking, not autocompletion. My background in analytics told me which metrics truly matter, my PM mindset kept the scope focused on solving real pain points, and my technical experience ensured the app stayed scalable and organized instead of turning into a clever but unusable prototype. The tracker became a living proof that the future of product building is not AI versus human but AI plus disciplined product thinking, where AI speeds up execution and the product craft keeps the compass pointed toward real human needs.