

Imagine you’re about to run a marathon, but instead of measuring miles, someone asks how many snacks you’ll need, how steep the hills are, and if there’s a bear lurking nearby, welcome to the world of story points for product teams. They don’t stress about hours; they focus on the real deal: effort, complexity, and risk behind building great stuff. Estimating time is like guessing how fast a toddler dresses, nearly impossible! Instead, story points turn planning into a team sport where designers, testers, developers, and product owners gather like a quirky group therapy for the backlog, deciding if a feature is a quick coffee break or a full Netflix binge. It’s collaborative, fast, and saves everyone from mid-sprint shock when things get way harder than expected.
The real magic happens when story points transform dull planning meetings into fun sessions, often with Planning Poker cards flying around like it’s game night. You argue less about hours and more about delivering real value without losing your sanity. Plus, story points take the pressure off individual speed, so nobody’s guilt-tripped for “working slowly” when the brain hits airplane mode. Myths? Oh, they’re busted too, story points aren’t spy tools or secret codes for overtime. They’re a shared language that helps teams vibe and improve together. For any product specialist, mastering story points is like snagging a backstage pass to the product show, you get to see the magic behind the scenes, all while having a little fun with the journey.
Based on my own experiences, countless conversations with fellow product specialists, and plenty of binge-listening to product management podcasts and books, here’s the scoop on story points.
Definition
Story points are a unit of measurements used by product teams, especially in Agile methodologies, to estimate the relative effort required to complete a user story or product backlog item. They reflect not just the time, but also the complexity, risk, and effort involved in delivering a feature or task. Story points help teams focus on the difficulty of work rather than the exact amount of time, allowing more flexibility and encouraging value-driven deliery.
Story points are assigned collaboratively by the entire cross-functional team during sprint planning or product backlog refinement. The team-based estimation approach brings diverse perspectives, from developers, testers, designers, and product owners, ensuring a better understanding of the work and the potential challenges.
Overall, story points are a critical tool in Agile product management to estimate effort, improve team alignment, prioritize effectively, and support interative and adaptive planning processes in product delivery.
Benefits
Story points benefit a product team by turning estimation into a fast, collaborative way to understand effort, complexity, and risk instead of arguing about hours and dates. Used well, they improve planning, focus the team on value, and support continuous improvement without becoming a proxy for individual performance.
Better than time-based estimates
- Story points capture relative effort, complexity, and uncertainty, not just duration, so they naturally account for unknowns, learning curves, and risk.
- Because they are abstract, they avoid the false precision of hour estimates and reduce emotional attachment to specific deadlines. Teams feel safer to be honest about difficulty.
Faster, lighter planning
- Estimating in points is usually quicker than debating exact hours, which reduces time spent in planning meetings and lets teams focus on delivery and discovery work.
- Once a team has a reference set of stories (1, 2, 3, 5, etc.), they can rapidly “size by comparison” rather than re-estimating from scratch.
Stronger team collaboration
- Story point estimation (especially with techniques like Planning Poker) forces cross‑functional conversations about assumptions, edge cases, and dependencies before work starts.
- These discussions build a shared mental model of the work, improve clarity of acceptance criteria, and expose hidden complexity early, which reduces surprises mid‑sprint.
Reliable forecasting and capacity planning
- By tracking velocity (average story points completed per sprint), teams can forecast how much work fits into a sprint or release without converting points to hours.
- Over time, this historical velocity allows product managers to model scenarios (e.g., “with our current velocity, these epics span three sprints”) and communicate realistic timelines to stakeholders.
Normalizing different skills and speeds
- Because points are relative and team‑based, they let people with different experience levels agree on effort without needing the same personal pace in hours.
- This shifts the conversation from “how fast is person X?” to “how hard is this work for our team?”, which avoids unhelpful comparisons of individual productivity.
Better focus on value, not just time
- Using points encourages product teams to ask “Is this big, risky item worth it?” and to slice stories smaller to maximize flow and incremental value delivery.
- Because estimates are not directly tied to contractual hours, product managers can prioritize based on impact versus effort (e.g., high‑value/low‑points items) instead of purely on duration.
Enabling continuous improvement
- Trends in story points and velocity highlight systemic issues: repeated spillover, over‑sized stories, or bottlenecks in certain domains.
- Teams can use these insights in retrospectives to refine slicing, improve technical practices, or adjust WIP limits, closing the loop between estimation and process improvement.
Velocity, the total story points completed per sprint, helps predict how much work the team can accomplish in future sprints. Also, story points help avoid focusing excessively on time estimates, which can be misleading due to variability in skills and unforeseen obstacles.
Types of Story Points Methodologies
There are several common methodologies for using story points in Agile product teams, each emphasizing relative estimation of effort, complexity, and risk rather than absolute time.
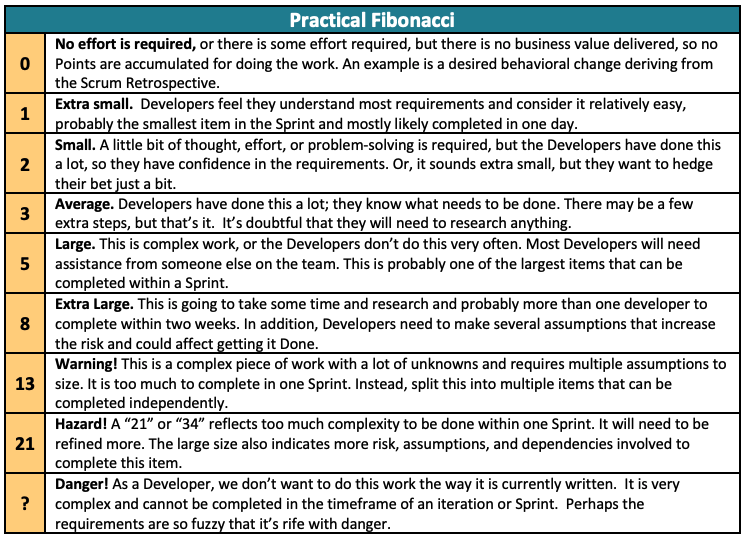
Fibonnaci Sequence Methodology
The most popular approach assigns story points using numbers from the Fibonacci sequence (1, 2, 3, 5, 8, 13, etc.). The increasing gaps between numbers reflect escalating uncertainty and complexity as task size grows.
When to use it?
- When the team already works in sprints and wants a standard story point scale that supports velocity tracking.
- When work varies in complexity and uncertainty, and you need a granular but simple numeric system for planning and forecasting.
How to implement it?
- Agree on a scale: typically 0,1,2,3,5,8,13,21.
- Co-create reference stories: pick real items and label them (e.g., “login bug = 1”, “simple UI tweak = 2”, “new API endpoint = 3”, “small feature = 5”, “cross-team feature = 8”).
- During refinement, compare every new story to these anchors: “Is this closer to our 3‑point or 5‑point story?”
- Treat anything at 13+ as a signal to slice smaller before bringing it into a sprint.
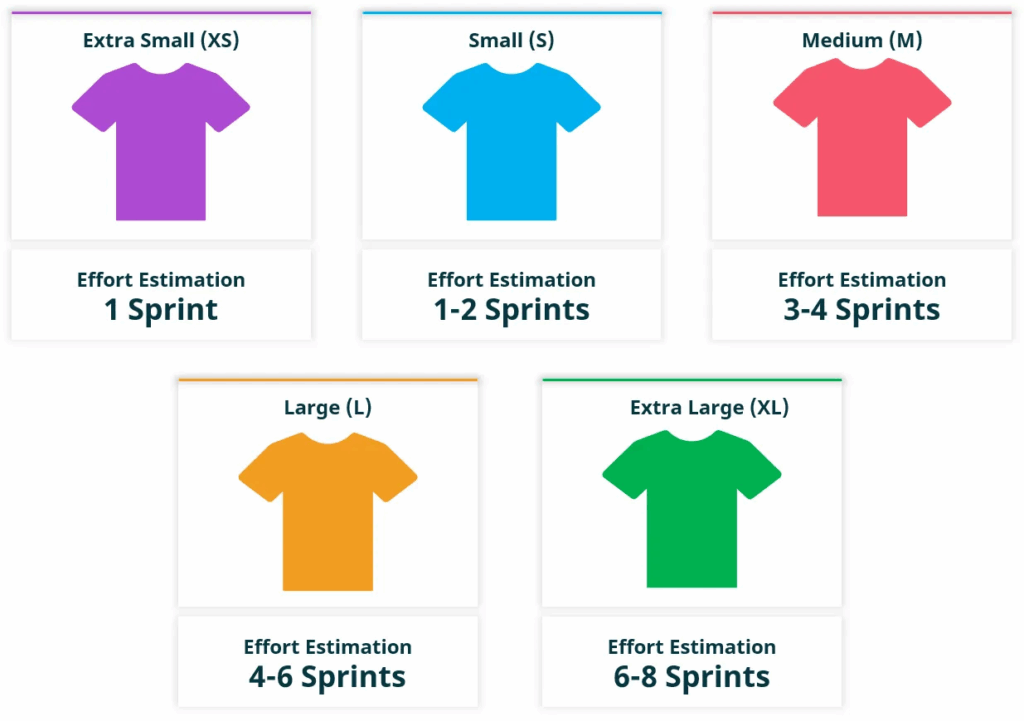
T-Shirt Sizing
A less granular method where stories are sized with relative “small-medium-large” categories (XS, S, M, L, XL). This approach is suited for high-level estimation without detailed numeric scoring, making it simpler but less precise.
When to use it?
- Very early phases: discovery, roadmap shaping, or quarterly planning, when details are fuzzy.
- When stakeholders are less technical and you need fast, intuitive sizing rather than precise estimates.
- When you’re comparing epics/themes, not sprint-ready user stories.
How to implement it?
- Define sizes together (e.g., XS, S, M, L, XL) and write down concrete examples for each.
- Use T‑shirt sizes in discovery sessions to roughly size epics and initiatives before breaking them down.
- Later, convert high-priority epics into user stories and use Fibonacci points for sprint planning if you need more precision.
- Keep T‑shirt sizing as a portfolio-level tool, not the main unit for sprint commitments.
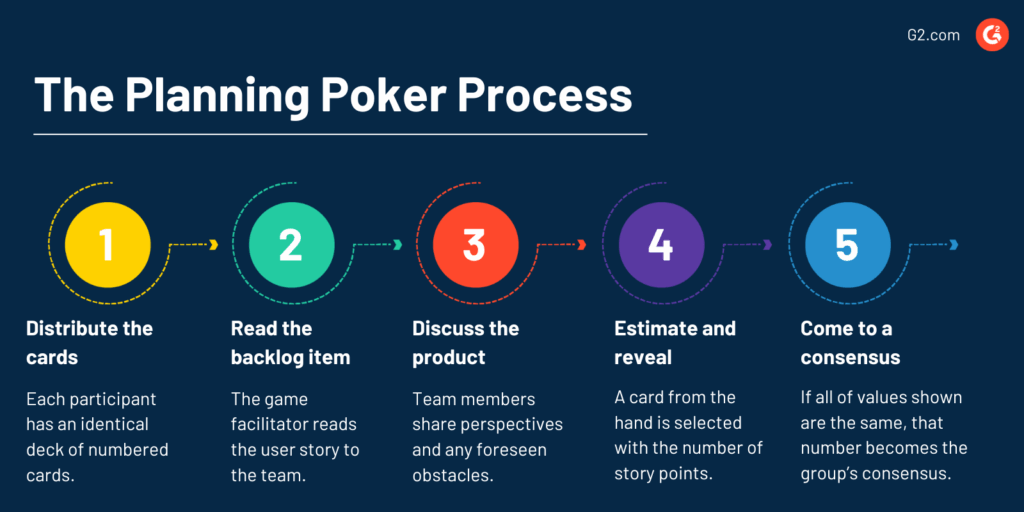
Planning Poker
A collaborative game where team members privately select story point cards (often Fibonacci-based), reveal simultaneously, then discuss discrepancies until consensus is reached. This methodology promotes team alignment, reduces individual bias, and leverages diverse expertise.
When to use it?
- When the team is new to story points or trust and shared understanding are still forming.
- When stories often hide complexity and you want a structured conversation to surface assumptions.
- For backlog refinement and sprint planning of small–medium backlogs.
How to implement it?
- Choose a base scale (Fibonacci or similar). Give everyone the same card deck (or digital tool).
- For each story: present it, let people ask clarifying questions, then estimate silently and reveal together.
- If estimates differ significantly, let high‑ and low‑estimators explain why; refine acceptance criteria or split the story as needed.
- Repeat the vote after discussion and aim for a good‑enough consensus, not perfection. Timebox each item to keep sessions lean.
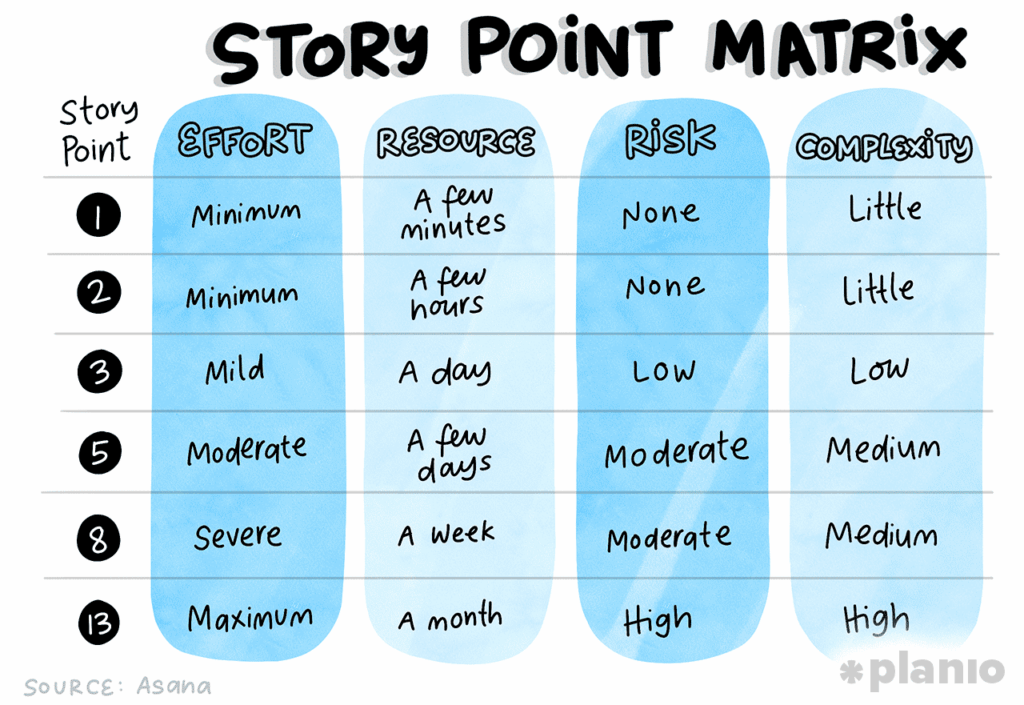
Story Point Matrix
Teams develop a reference matrix mapping story points to levels of effort, complexity, and risk. This matrix helps standardize understanding of what each point value means, evolving over time as team velocity and experience grow.
When to use it?
- When you already use points but consistency varies between people, squads, or over time.
- Helpful for larger organizations, multiple teams, or frequent onboarding of new members.
- When you want clearer guidance on what “3 vs 5 vs 8” actually means in your context.
How to implement it?
- With the team, define a simple matrix (e.g., rows: effort, complexity, risk; columns: 1, 2, 3, 5, 8 points) and describe each cell in plain language.
- Map a few completed stories to the matrix so people see real examples.
- Keep the matrix visible (Confluence/Notion/MIRO) and use it during refinement as a reference, not a rulebook.
- Review and update it every few months in retrospectives as the team’s skills, tooling, and architecture evolve.
Qualitative Approaches
Some teams incorporate lightweight or alternative methodologies focusing on value delivery rather than just estimating effort. Examples include Shape Up cycles or Amazon’s Working Backwards, where the emphasis is on defining clear work boundaries and outcomes over exact estimation.
When to use it?
- In high-uncertainty or discovery-heavy environments (e.g., early-stage products, experiments, research work).
- When you care more about flow and outcomes than detailed capacity planning.
- When story points feel like overhead and your main bottleneck is clarity, not estimation.
How to implement it?
- Replace or supplement numeric points with qualitative labels like “spike”, “small experiment”, “bounded bet”, “big bet”.
- Timebox work instead of sizing in detail (e.g., “2‑day spike to learn X” or “one-sprint experiment”).
- Use flow metrics (cycle time, WIP, throughput) and regular retrospectives to manage capacity and improve predictability.
- You can still keep rough T‑shirt sizing at initiative level while using purely qualitative framing for research and experiments.
| Methodology | Pros | Cons |
|---|---|---|
| Fibonacci Sequence | – Reflect growing uncertainty and complexity well | – Intimidating for new teams |
| – Encourage relative, not absolute estimation | – Subjective, consensus-dependent | |
| – Widely adopted, easy team alignment | – Can overcomplicate simple tasks | |
| T-Shirt Sizing | – Simple, intuitive, easy for all members | – Less precise, harder for velocity tracking |
| – Good for high-level, early planning | – Size categories can be interpreted differently | |
| – Engage non-technical stakeholders | – Difficult for cross-team comparisons | |
| Planning Poker | – Encourage collaboration, shared understanding | – Time-consuming, especially with large backlogs |
| – Mitigate individual bias through simultaneous voting | – Needs skilled facilitation | |
| – Foster knowledge sharing, consensus | – Risk of dominant voices influencing consensus | |
| Story Point Matrix | – Standardise estimation language and consistency | – Require effort to maintain and update |
| – Helpful for onboarding new team members | – Can become rigid, limiting flexibility | |
| – Evolve with team maturity | – Might slow estimation sessions | |
| Qualitative Approaches | – Focus on value and outcomes over effort | – Lack quantitative metrics for planning |
| – Reduce estimation overhead | – Harder to benchmark and compare objectively | |
| – Suitable for exploratory, uncertain phases | – Limit data-driven forecasting |
Each methodology offers unique strengths and trade-offs. Teams often choose or combine techniques based on their context, project phase, and collaboration style to optimize esimation, accuracy, efficiency, and shared understanding.
Apart from just choosing one of the story points methodologies, it is also possible to combine two or more story points methodologies. A practical setup many strong teams use
- Discovery / roadmap level: T‑shirt sizing + qualitative labels to compare big bets and set expectations early.
- Delivery level (sprints): Fibonacci story points estimated via Planning Poker, using a lightweight Story Point Matrix for alignment.
- Exploratory work: qualitative, timeboxed items where you explicitly accept uncertainty and do not over‑estimate.
Guidelines to Implement Story Points in a Product Team
Implementing story points in a product team works best as a deliberate change in how you estimate, plan, and learn. Here is practical, step-by-step approach you can run as a Product Manager or a Product Owner
Step 1 – Align on purpose and principles
- Explain to the team that story points are for relative effort (complexity, risk, and uncertainty), not for tracking individual performance or converting directly to hours.
- Share the benefits: faster planning, better forecasting via velocity, safer discussion of uncertainty, and focus on slicing work instead of over‑specifying dates.
Step 2 – Choose and document your scale
- Pick a simple, widely used scale, such as Fibonacci (1, 2, 3, 5, 8, 13, 21) plus special cards like 0 and “?”.
- Document what each value roughly means for your team (e.g., 1 = trivial change, 3 = normal story, 8 = big and risky, probably needs splitting) and keep this visible in your workspace or Confluence/Notion.
Step 3 – Establish baseline reference stories
- With the whole team, pick a few real stories you already completed or clearly understand and agree: “this is a 2,” “this is a 5,” “this is an 8.”
- Use these as anchors for all future estimates, always comparing new work to these baselines rather than thinking in hours (“Is this closer to our 3‑point login story or our 5‑point onboarding story?”).
Step 4 – Integrate story points into refinement and planning
- During backlog refinement, ensure user stories are clear, small, and have acceptance criteria before estimating; split anything that feels like 13+ or “?” into smaller slices.
- Use a collaborative technique such as Planning Poker: everyone estimates silently, reveal together, discuss big differences, and converge on a final number.
Step 5 – Start tracking velocity and using it for forecasts
Step 6 – Communicate with stakeholders without exposing the mechanics
- Translate points and velocity into ranges and scenarios for non‑technical stakeholders (e.g., “At our current throughput, this epic is 2–3 sprints.”) rather than teaching them the full math.
- Emphasize that points are internal to the team and should not be used for comparing teams or judging individual productivity, which can undermine trust and distort estimation behavior.
Step 7 – Inspect, adapt, and refine your approach
- In retrospectives, look at where estimates were consistently off: were stories too big, requirements unclear, or dependencies underestimated?
- Iterate on your scale definitions, baseline stories, and refinement practices; the goal is not “perfect” estimates but a shared language that improves over time and supports better product decisions.
The Myths about Story Points in a Product Team
Story points are powerful when used well, but a lot of teams struggle because of persistent myths and misconceptions. These myths usually come from treating story points as a control tool instead of a planning and learning tool.
Myth 1 – “Scrum requires story points”
Scrum requires estimation, but it does not mandate story points or any specific technique. Teams can use hours, T‑shirt sizes, or no estimates at all, as long as they inspect and adapt effectively. The risk of this myth is that teams cling to story points even when they do not understand them or when another approach would fit their context better.
Myth 2 – “Story points equal hours”
Story points are a relative measure of effort, complexity, and uncertainty, not a time unit. Trying to define “1 point = 4 hours” destroys their abstraction, makes estimates rigid, and prevents people with different speeds from agreeing on a single size. When teams convert points back to hours, they lose the benefit of thinking in relative sizes and fall back into the same traps as time‑based estimation.
Myth 3 – “More points means a productive team”
Story points are for internal planning, not for comparing productivity across teams or individuals. Using points as a performance metric encourages gaming (inflating estimates), pressure, and blame instead of honest estimation. Two teams with different baselines can have very different velocities, and that is perfectly normal.
Myth 4: “Story points measure only complexity”
Story points represent overall “size” of a backlog item, which typically blends effort, complexity, risk, and uncertainty. Treating them as “complexity only” ignores factors like testing effort, integration work, or unclear requirements that also drive real cost and risk. A good estimation conversation should surface all of these dimensions, not just technical difficulty.
Myth 5 – “Estimates are useless because they are always wrong”
Estimates are not promises; they are a communication tool and a starting point for planning. Even imperfect estimates help teams understand capacity, slice work, and have better conversations about trade‑offs and risk. The goal is not to predict perfectly, but to be “accurate enough” to make sensible decisions and improve over time.
Myth 6 – “Only senior people should estimate”
Cross‑functional, whole‑team participation is essential to healthy story point estimation. Excluding juniors or non‑engineers misses important perspectives on testing, UX, operations, and risk, and reinforces hierarchy instead of collaboration. Involving everyone helps build shared understanding and grows estimation skills across the team.
Myth 7 – “We must always refine points until everyone fully agrees”
Healthy disagreement in Planning Poker or similar techniques is a sign of useful discussion, not failure. The objective is a shared, “good enough” estimate, not mathematical precision, because the work and context will change anyway. Over‑optimizing for consensus wastes time and can push quieter voices to conform to the loudest opinion.
Myth 8 – “Higher velocity is always better”
Velocity is a planning signal, not a performance scoreboard. When teams are pushed to “increase velocity,” they may inflate estimates, cut quality, or slice stories in artificial ways just to move the numbers. What matters is stable, sustainable velocity that reflects real value delivered, not chasing bigger numbers sprint after sprint.
Myth 9 – “Story points alone will improve estimation”
Story points are just one tool; estimation quality depends more on practices like good refinement, clear acceptance criteria, and splitting work into small, testable slices. Without these basics, story points can feel random and frustrating for the team. Techniques such as Planning Poker, baselining, and regular retrospectives are what make the system effective.
Myth 10 – “If story points do not work here, Agile has failed”
Some teams and domains genuinely find other methods (e.g., no‑estimates, flow‑based metrics, or pure T‑shirt sizing) more natural. Struggling with story points often signals a mismatch between the tool and the team’s context, or underlying issues like poor backlog quality, unclear goals, or misaligned incentives. Agile values outcomes and learning, not adherence to a specific estimation ritual.