

Picture this: You’re a sharp product specialist, coffee in one hand, Slack exploding in the other, staring at a backlog longer than your weekend to-do list (which, let’s be honest, is just “Netflix and nap”). The leadership team is pushing for AI magic now, engineering’s muttering about a “tech debt apocalypse,” and users are pleading for that one fix that’d make them your lifelong fans. Without prioritization? Pure chaos, like herding caffeinated squirrels on espresso. But grab a solid framework? Boom, you’re the wizard channeling those scarce superpowers into features that spike revenue, retention, and those heartwarming customer high-fives.
Fast-forward to your first “aha” moment: No more shiny-object syndrome or endless “but what about…?” debates. Imagine saying “no” confidently (with data!), watching scope creep slink away, and seeing your roadmap light up with quick wins that delight users and bosses alike, while freeing time for innovative sparks instead of firefighting. It’s like giving your team a superpower: focused, aligned, and delivering ROI that makes everyone grin. Welcome to the club, where prioritization turns overwhelm into “we got this” with a wink and a spreadsheet.
Drawing from hands-on battles with backlogs, endless chats with fellow product specialists over virtual coffees, and a healthy dose of product management podcasts and books devoured during late-night scrolls, here’s the straight scoop on prioritization frameworks.
What Is Product Prioritization?
Product prioritization is a structured approach used by product teams to decide which features, projects, or improvements to pursue next. The goal is to maximize impact with available resources while aligning delivery with customer and business needs. Effective prioritization reduces uncertainty and supports decision-making transparency for stakeholders.
Core Purpose in Product Management
In product management, prioritization eliminates wasteful efforts by balancing competing demands from customers, stakeholders, and strategic goals. It ensures teams focus on initiatives that align with long-term objectives, such as revenue growth or user retention, while deprioritizing lower-impact work. This disciplined approach reduces guesswork, fosters transparency, and accelerates time-to-market for high-value outcomes.
The Benefits of Product Prioritization in Product Management
Product prioritization delivers significant advantages by enabling product teams to focus limited resources on high-impact work, aligning efforts with strategic goals, and driving measurable business outcomes.
Resource Optimization
Product prioritization enhances resource optimization by directing limited time, budget, and personnel toward high-return initiatives through structured scoring of value versus effort, slashing waste on low-priority tasks by up to 40% in optimized teams and preventing scattered efforts that dilute productivity. This focus eliminates scope creep, common in unprioritized backlogs, accelerates delivery cycles, and unlocks innovation capacity as teams tackle fewer, deeper projects rather than juggling dozens of minor ones. Consequently, ROI surges as investments yield tangible outcomes like faster market entry and scalable growth, with frameworks ensuring defensible allocations that adapt to capacity constraints without burnout or overruns.
Strategic Alignment and Focus
Product prioritization strengthens strategic alignment and focus by embedding business objectives, like revenue growth, user retention, or market expansion, directly into scoring criteria, ensuring daily tasks and roadmap items ladder up to long-term vision rather than chasing “shiny objects” or tactical distractions. This disciplined linkage prevents siloed efforts, maintains competitive positioning through customer-centric priorities, and fosters a unified roadmap that rallies cross-functional teams around shared goals, boosting overall product success in aligned organizations via faster execution and reduced strategic drift.
Improved Decision-Making
Structured prioritization sharpens decision-making by replacing bias and endless debates with objective, data-driven criteria like impact, effort, confidence, and urgency, slashing decision paralysis that delays product roadmaps and empowering teams to swiftly rank initiatives. Transparent rationales such as scored matrices or frameworks, demystify choices for stakeholders, cultivating trust that accelerates planning cycles while balancing quick wins (e.g., retention fixes) against enduring value (e.g., scalability investments). This fosters agile, informed execution where product managers confidently say “no” to distractions, ensuring sustained innovation and alignment without second-guessing.
Enhanced Customer and Business Value
Product prioritization amplifies customer and business value by laser-focusing on features that resolve key user pain points, validated via feedback, NPS, or session data, driving engagement, satisfaction, and loyalty metrics upward while accelerating time-to-market for high-ROI work like revenue boosters or delight features. This targeted approach enhances adoption and retention through frameworks like RICE or Kano, which balance user delight against effort, ultimately sharpening competitive positioning and yielding tangible outcomes such as faster growth and superior KPIs in dynamic markets.
Improved Stakeholder Collaboration and Trust
Documented prioritization decisions and criteria forge a shared “common language” that unites cross-functional partners, engineering, sales, marketing, executives—around objective evidence like scored matrices, slashing conflicts as stakeholders actively contribute and witness trade-offs, cultivating genuine buy-in and ownership. This transparency transforms adversarial dynamics into collaborative partnerships, accelerating alignment on roadmaps and reducing friction in execution, with teams 2.5x more likely to succeed through heightened trust and consensus.
Improved Quality of Trade-off Decisions
Product prioritization improves the quality of trade-off decisions by systematically weighing benefits like customer value and revenue potential against costs such as effort, risk, and opportunity expenses, providing clear, defensible rationales for deprioritizing less critical features. This explicit evaluation prevents emotional or hasty choices, uncovers hidden dependencies early, and aligns teams on inevitable compromises, drastically cutting rework, often by 30-50% in mature processes, while curbing scope creep that plagues unprioritized projects. Ultimately, it fosters confident execution, as stakeholders grasp the “why” behind exclusions, enabling faster iterations and higher-impact deliveries without constant pivots.
Strengthened Governance and Compliance
Documented prioritization criteria and decisions establish a principled, auditable trail that satisfies governance needs, regulatory audits, and stakeholder mandates by demonstrating objective evaluations against standards like risk, compliance, and ROI, averting penalties from non-compliance in regions such as the EU’s GPSR or US FDA rules. This transparency not only streamlines inspections and legal defenses, reducing disputes by proving alignment with business goals, but also enforces accountability across teams, minimizing rework from overlooked requirements and ensuring sustainable operations in regulated industries.
Supporting Adapability in Dynamic Environments
Regular re-prioritization with fresh data, such as customer feedback, market shifts, or competitive intel, keeps roadmaps agile and responsive in volatile environments, enabling swift pivots like Spotify’s playlist tweaks amid user trends without derailing core alignment. This iterative cadence preserves strategic coherence by re-scoring against fixed criteria, cutting response times to changes while avoiding chaotic resets, ensuring sustained value delivery amid uncertainty.
Popular Prioritization Frameworks
Many teams use prioritization frameworks to support these decisions. Some widely adopted techniques include\
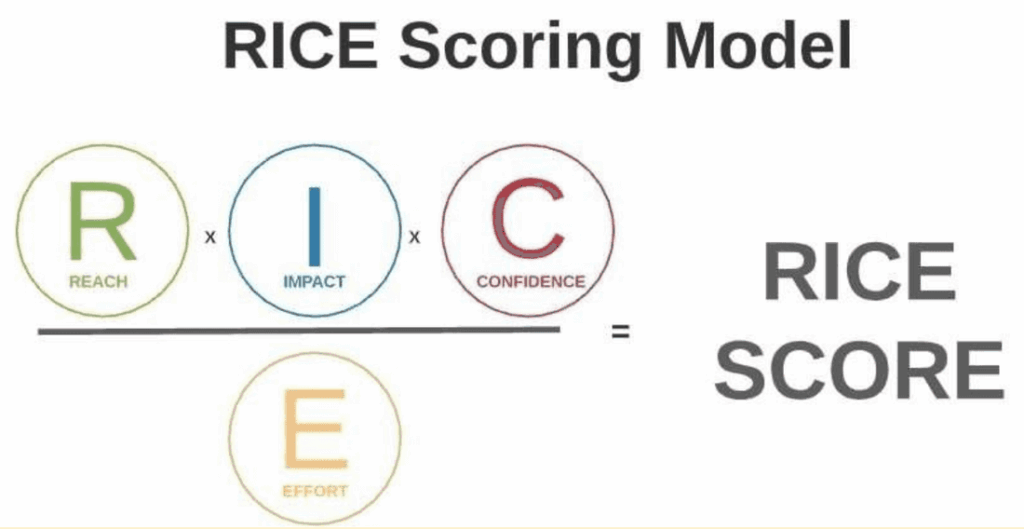
RICE (Reach, Impact, Cofidence, Effort)
The RICE framework (Reach, Impact, Confidence, Effort) is a quantitative prioritization model developed by Sean McBride at Intercom to help product teams score and rank initiatives objectively. Reach measures how many users, customers, or events (e.g., transactions per quarter) the initiative will affect, often sourced from analytics. Impact assesses the expected effect on business goals or user satisfaction on a scale like 3 (massive), 2 (high), 1 (medium), 0.5 (low), or 0.25 (minimal). Confidence quantifies certainty in Reach and Impact estimates as a percentage (100% high, 80% medium, 50% low), accounting for data gaps. Effort estimates required work in “person-months” (e.g., total team weeks/months divided by 4). Higher scores indicate top priorities.
When to use it?
RICE excels for mature products with quantitative data, such as SaaS platforms tracking metrics like conversions or retention, where balancing scale and uncertainty matters, ideal for B2B/C teams avoiding bias in feature backlogs. Avoid it for early-stage ideation lacking data or qualitative-heavy decisions (use Kano instead); best for quarterly roadmaps or sprint planning amid competing stakeholder requests.
How to implement it?
- List initiatives from backlog/customer feedback.
- Score each factor collaboratively: Gather data (analytics, surveys) for Reach/Impact; estimate Confidence via past experiments; forecast Effort with planning poker.
- Calculate scores in a shared spreadsheet; rank highest-to-lowest.
- Review quarterly, adjusting for new data to maintain agility.
Example: Feature A (Reach: 1,000 users/qtr, Impact: 2, Confidence: 80%, Effort: 3) scores (1000×2×0.8)/3 = 533, prioritize over Feature B at 525. This fosters transparency, with teams 2x more aligned on “do first” items.
Formula
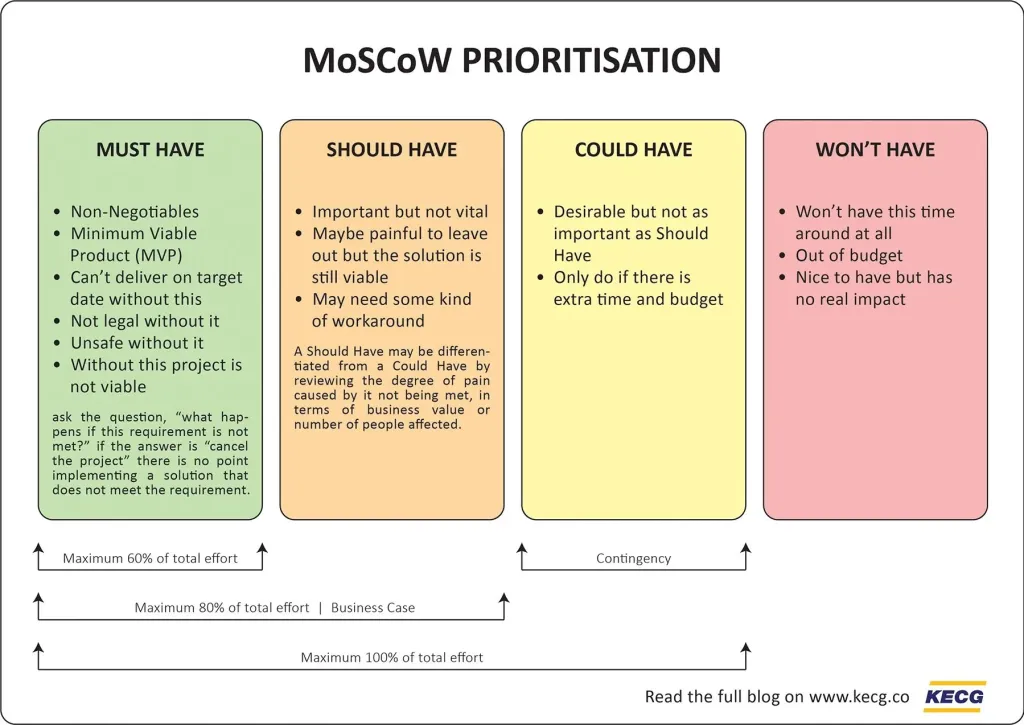
MoSCoW (Must-have, Should-have, Could-have, Won’t-have)
The MoSCoW framework is a qualitative prioritization technique originating from Dynamic Systems Development Method (DSDM) agile practices, categorizing initiatives into four buckets: Must have (non-negotiable essentials for viability, ~60% effort max), Should have (important but deferrable), Could have (desirable if time allows, ~20% effort), and Won’t have (explicitly excluded this cycle to manage scope).
When to use it?
Ideal for time-boxed projects with fixed deadlines, budgets, or resources, like MVP launches, sprints, or regulatory releases, where stakeholder alignment trumps quantitative data. Suited for early-stage products, cross-functional teams, or scenarios with competing demands; avoid for data-rich environments (use RICE) or infinite backlogs lacking clear goals.
How to implement it?
- Gather inputs: List features/requirements from backlog, stakeholders, and users; define success criteria, constraints (time/budget), and timebox (e.g., release cycle).
- Collaborate on categorization: Workshop with product, engineering, sales/marketing—assign MoSCoW labels via voting or discussion, ensuring Must-haves meet MVP viability.
- Document and share: Create a visible matrix/spreadsheet with rationales; cap Must-haves at 60% to leave buffer.
- Review iteratively: Reassess at sprint/quarter ends, moving items as needed; track Won’t-haves for future.
Example: For a SaaS dashboard MVP—Must: User login (viability); Should: Basic charts (value-add); Could: Export (nice-to-have); Won’t: AI insights (next release). This fosters buy-in, cuts scope creep, and boosts delivery success by 2-3x in constrained settings.
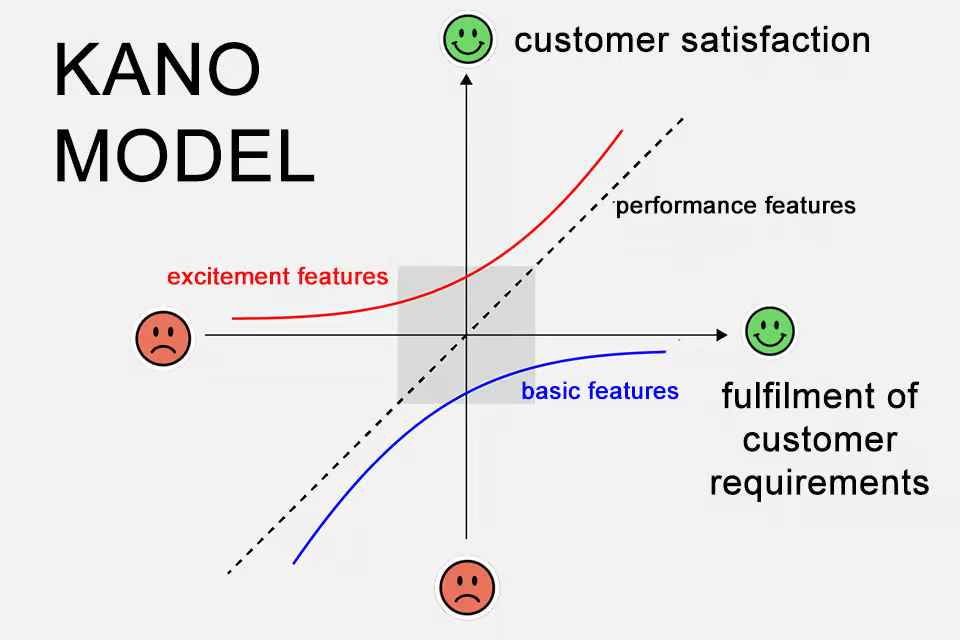
Kano Model
The Kano Model, developed by Noriaki Kano in the 1980s, is a customer-centric prioritization framework that categorizes features based on user satisfaction responses to their presence or absence, plotting them on a curve from dissatisfaction (basic needs unmet) to delight (unexpected value). Categories include: Must-be/Basics (expected hygiene factors like login; absence causes dissatisfaction but presence doesn’t excite); Performance/Linear (proportional satisfaction, e.g., faster load times); Attractive/Delighters (wow factors like free same-day delivery that boost loyalty); Indifferent (neutral, low priority); and Reverse (features that frustrate users).
When to use it?
Best for consumer products, UX/UI enhancements, or mature roadmaps needing delight differentiation, especially when quantitative data is scarce but customer voice is key (e.g., SaaS retention or e-commerce). Use pre-MVP to validate assumptions or quarterly to refresh backlogs; avoid for purely internal tools or time-boxed sprints (favor MoSCoW) due to survey overhead.
How to implement it?
- Select features: List 15-20 candidates from backlog/user research.
- Conduct survey: Target 12-24 representative users (e.g., via Typeform); per feature, ask: “How do you feel if [feature] is present?” and “How do you feel if [feature] is absent?” Options: Like/Expect/Neutral/Live with/Dislike. Add importance scale.
- Analyze: Map responses to categories using evaluation table (e.g., Like + Neutral = Attractive); calculate satisfaction/dissatisfaction indices for continuous scoring; plot on matrix (satisfaction vs. investment).
- Prioritize: Must-bes first (fix gaps), then Performance, add Delighters if capacity; deprioritize Indifferent/Reverse. Review quarterly.
Example: Survey reveals search bar as Must-be (dissatisfaction if absent), personalized recs as Delighter, prioritize accordingly for 20-30% satisfaction lift. This data-driven delight focus outperforms generic scoring by aligning directly with emotional ROI.
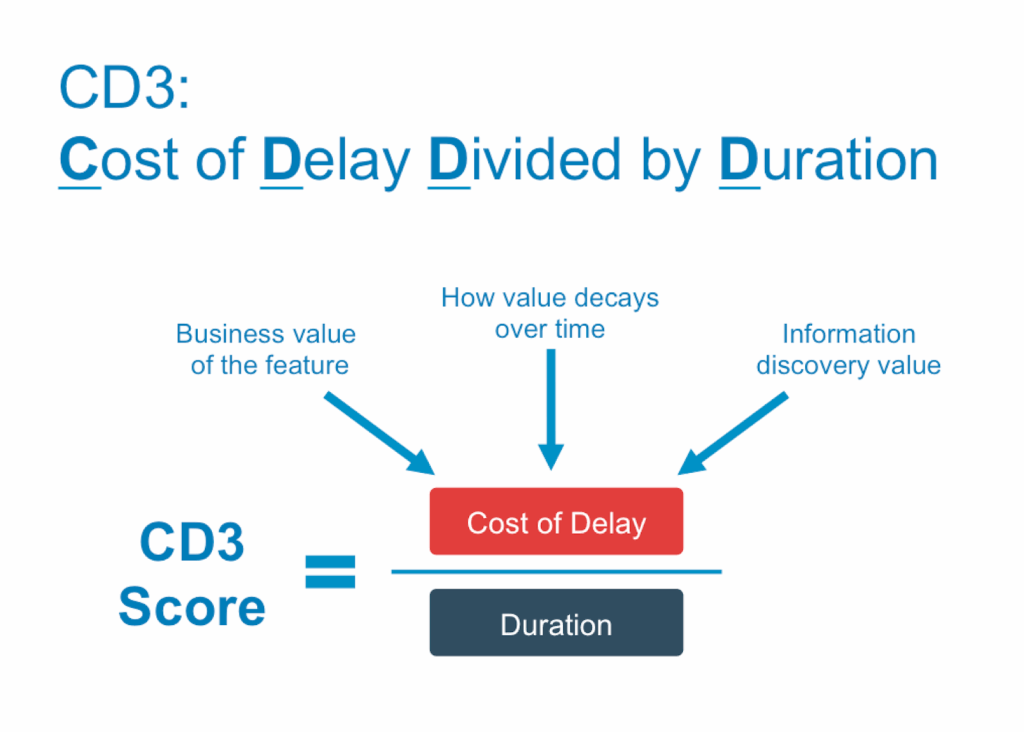
Cost of Delay / CD3
The Cost of Delay (CoD) framework, often extended as CD3 (Cost of Delay Divided by Duration), quantifies the economic impact of delaying an initiative—measuring lost revenue, user value, or opportunity per time unit (e.g., $/month)—then divides by estimated completion time to prioritize highest value-per-time first via CD3 = CoD / Duration. CoD typically breaks into revenue forgone, user pain/risk reduction, and opportunity enablement; Duration uses the longest team path (adding serial dependencies), enabling objective ranking over gut feel.
When to use it?
Ideal for revenue-focused products (SaaS, e-commerce) with quantifiable impacts, portfolio-level decisions across teams, or deadline-sensitive scenarios where delay compounds costs (e.g., compliance features). Suited for scaled agile environments with multiple dependencies; avoid early ideation without data, non-monetary goals (use Kano), or tiny backlogs (overkill).
How to implement it?
- Define CoD: For each initiative, estimate monthly loss (ex: Feature A: $15k/month from delayed revenue + risk); collaborate with finance/sales for accuracy.
- Estimate Duration: Engineering forecasts team effort (ex: 3 months max path); adjust for dependencies.
- Calculate & Rank: CD3 = CoD / Duration (ex: A: $15k/3 = $5k/month; B: $15k/2 = $7.5k/month → prioritize B); use spreadsheets for local/global views.
- Review Iteratively: Reassess quarterly with new data; override for strategic bets (ex: ~20% capacity).
Example: Idea C ($3.25k/week CoD, 1 week duration) CD3=3250 beats Idea A ($5.85k/week, 4 weeks=1463), reducing total delay cost 21% vs. total-value ranking. This economics-driven method boosts ROI by 20-50% in data-mature teams.
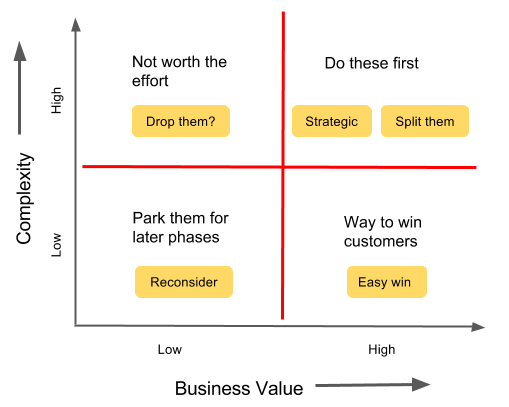
Value vs Complexity
The Value vs. Complexity framework (also called Value vs. Effort) is a simple 2×2 matrix prioritization model that plots initiatives on axes of business/user Value (high/low, based on revenue, retention, satisfaction, or strategic fit) versus Complexity/Effort (high/low, factoring dev time, cost, risks, dependencies), enabling quick visual ranking to favor high-value, low-complexity “quick wins.”
When to use it?
Best for early-stage roadmapping, sprint planning, or resource-constrained teams needing fast, intuitive decisions without heavy data, ideal for startups, UX enhancements, or cross-functional alignment where qualitative judgment suffices. Use when balancing ROI with feasibility; avoid for revenue-critical or scaled portfolios (prefer CD3/RICE) or pure delight focus (Kano).
How to implement it?
- List initiatives: Compile 10-20 items from backlog, feedback, or strategy.
- Score Value (0-10 or high/medium/low): Weigh revenue potential, customer impact, alignment (ex: weighted: 40% revenue + 30% users + 30% strategy).
- Score Complexity (0-10): Estimate effort via team input (ex: person-weeks, tech debt); low <3 months, high >6.
- Plot & Prioritize: Map on quadrant—High Value/Low Complexity (top priority, “quick wins”); High Value/High Complexity (next, if capacity); Low Value/Low Complexity (fillers); Low Value/High Complexity (deprioritize/shelve). Review bi-weekly.
Example: Feature A (Value: 9/10 revenue boost, Complexity: 2/10 simple UI tweak) lands top-left; Feature B (Value: 8, Complexity: 9 backend overhaul) upper-right, do A first for 2x faster ROI. This visual tool cuts bias, boosts alignment, and frees 20-30% capacity for innovation.
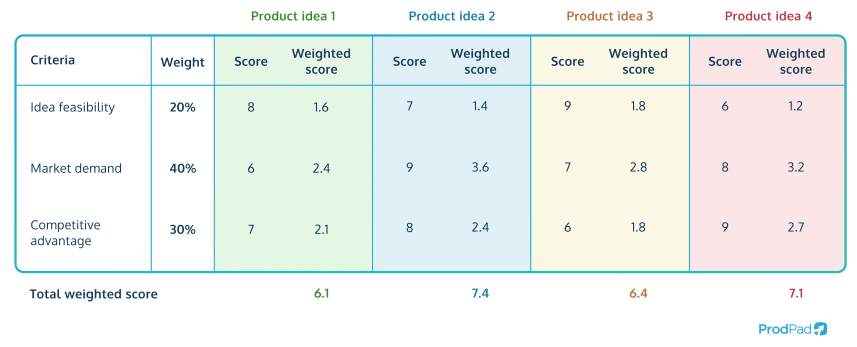
Weighted Scoring / Benefit vs Cost
The Weighted Scoring (or Benefit vs. Cost) framework is a customizable, quantitative prioritization model that evaluates initiatives by scoring them against multiple predefined criteria such as revenue potential, customer impact, strategic alignment (benefits), and effort, cost, risk, dependencies (costs)—with assigned weights reflecting their relative importance, then calculating a total score via Weighted Score = Σ (Criterion Score × Weight) to rank objectively.
When to use it?
Ideal for complex, multi-stakeholder environments like enterprise SaaS, portfolio management, or B2B products where balancing diverse factors (e.g., ROI, compliance, UX) outweighs simplicity, perfect for mid-to-late stage roadmaps with data availability. Suited for cross-functional alignment; avoid for quick sprints (use Value vs. Complexity) or pure economics (CD3).
How to implement it?
- Define criteria: List 5-10 factors (ex: Revenue: 30% weight, Effort: 20%, Risk: 15%); ensure they align with goals, totaling 100%.
- Assign weights: Workshop with stakeholders (ex: Customer Value: 25%, Strategic Fit: 20%) to prioritize.
- Score initiatives: Rate each (1-10 scale) per criterion based on data/estimates (ex: Feature A: Revenue=9).
- Calculate & rank: Multiply scores by weights, sum for total (ex: A: (9×0.3)+(8×0.2)=3.7); sort highest first. Review quarterly.
Example: Criteria: Revenue (40%), Retention (30%), Effort (30%); Feature X scores 8/10 Revenue, 9 Retention, 4 Effort → (8×0.4)+(9×0.3)+(4×0.3)=6.9, beating Y at 5.8—prioritize X for 25-40% better alignment. This reduces bias, boosts transparency, and improves ROI by focusing on holistic value.
| Framework | Pros | Cons |
|---|---|---|
| RICE | – Quantitative and data-driven, reducing bias with formula (Reach × Impact × Confidence / Effort) for objective ranking | – Requires reliable data, challenging for early-stage or low-traffic products where estimates are guesses |
| – Balances scale (Reach), value (Impact), uncertainty (Confidence), and feasibility (Effort), ideal for scaling products | – Subjective scaling (e.g., Impact 0.25-3) can introduce bias if not calibrated; Effort often optimistic | |
| – Transparent scores foster stakeholder alignment; adaptable with real metrics like user counts or A/B tests | – Overlooks strategic non-quantifiable factors like compliance or brand; time-intensive for large backlogs | |
| MoSCoW | – Simple, qualitative categorization excels in time-boxed projects, forcing scope discipline (e.g., cap Must at 60%) | – Highly subjective without guidelines, leading to bloated Must-haves or debates |
| – High stakeholder buy-in via workshops; quick for sprints/MVPs, reducing scope creep effectively | – Lacks nuance for value comparison across categories; not ideal for data-rich or portfolio decisions | |
| – Flexible for agile iterations; explicit “Won’t” manages expectations transparently | – Binary nature ignores gradients (e.g., high Should vs. low); requires frequent reviews to avoid staleness | |
| Kano Model | – Customer-centric via surveys, revealing delighters (Attractives) for loyalty and basics (Must-bes) to avoid dissatisfaction | – Survey overhead (100+ responses needed for validity) is resource-heavy and slow |
| – Visual matrix plots satisfaction vs. effort, prioritizing emotional ROI over assumptions | – Results evolve over time (delighters become expected); poor for non-user-facing or B2B tools | |
| – Uncovers hidden needs; great for UX/consumer products, boosting NPS 20-30% with delighters | – Analysis complexity with categories; doesn’t quantify business value directly | |
| Cost of Delay / CD3 | – Economics-focused (CoD / Duration) maximizes ROI by prioritizing time-sensitive value, cutting total delay costs 20-50% | – Hard to estimate CoD accurately without historical data; ignores non-monetary value (e.g., learning) |
| – Handles dependencies/portfolio scale; data from finance/sales adds credibility | – Assumes linear delay costs (unrealistic for markets); Duration forecasts prone to error in complex flows | |
| – Forces delay quantification, revealing urgency (e.g., revenue leaks) | – Overkill for non-revenue products; requires maturity for reliable inputs | |
| Value vs. Complexity | – Intuitive 2×2 matrix for quick visuals; spots “quick wins” (high value/low complexity) effortlessly | – Oversimplifies with binary axes; subjective scoring without weights leads to bias |
| – Balances ROI with feasibility; great for workshops, startups, or UX without deep data | – Ignores interdependencies or time sensitivity; poor for scaled/quantitative needs | |
| – Low effort to implement; fosters team consensus visually | – Static unless refreshed often; doesn’t capture confidence or reach | |
| Weighted Scoring | – Highly customizable to criteria (e.g., revenue 40%, risk 20%); holistic for enterprises with diverse goals | – Setup time for criteria/weights invites debates; score inflation common without anchors |
| – Objective totals reduce arguments; excels in multi-stakeholder alignment | – Can feel arbitrary if weights misaligned; complex spreadsheets overwhelm small teams | |
| – Scalable for portfolios; integrates data/strategy seamlessly | – Multiplies errors across factors; less intuitive than matrices for quick decisions |
Each prioritization framework brings distinct advantages and limitations. Product teams typically select or blend approaches according to their specific situation, development stage, and team dynamics to enhance precision, speed, decision quality, and collective alignment. For instance, a financial product may favor Cost of Delay, while a consumer-facing app may center on Kano or RICE to balance user delight and reach.
Step-by-Step Guide to Adopting a Prioritization Framework
Start by assessing your team’s context: product stage (early vs. mature), data availability, team size, and goals (ex: revenue vs. delight). Pilot one framework like RICE or Value vs. Complexity for 1-2 quarters before scaling.
Step 1 – Align on Goals and Buy-In
- Convene product, engineering, design, sales, and execs to define 2-3 OKRs (ex: “grow retention 20%”) and constraints (budget, capacity).
- Educate via 1-hour workshop: demo frameworks, pros/cons, and a live mini-exercise. Secure commitment to pilot.
Step 2 – Inventory and Clean Backlog
- Gather all ideas: user feedback, support tickets, stakeholder requests (aim for 20-50 items).
- Remove duplicates/obvious nos; tag with rough value/effort estimates for quick wins.
Step 3 – Select and Customize Framework
Step 4 – Run Initial Scoring Session
- Timebox 2-4 hours: List items, score collaboratively (ex: planning poker for effort).
- Use data where possible (analytics, surveys); average scores or vote for consensus. Calculate/rank.
Step 5 – Build and Communicate Roadmap
- Slice top items into sprints/releases; allocate 20% buffer for surprises/strategy.
- Visualize (Gantt, portfolio kanban); share with rationale, “Why this over that?”, via all-hands or Slack.
Step 6 – Execute, Measure, and Iterate
Pitfalls, Myths, and Mitigation Strategies in Prioritization Frameworks
Prioritization frameworks prove highly effective when applied thoughtfully, yet many product teams falter due to entrenched myths and misconceptions, often stemming from viewing them as rigid control mechanisms rather than flexible tools for collaborative planning and continuous learning.
Common Pitfalls
- No agreed scoring guidelines: Teams assign “high impact” differently (1% vs. 10% growth?), leading to inconsistent, biased rankings and conflicts.
- Everything labeled “Must-Have”: MoSCoW or similar backlogs bloat with 90% urgents, diluting focus and causing scope creep.
- Ignoring constraints: Dependencies, deadlines, or skills override criteria without rules, eroding trust in the process.
- Over-complicating setup: Endless debates on weights/criteria or massive spreadsheets waste more time than execution gains.
- Static priorities: Failing to re-prioritize quarterly amid market shifts or data leads to irrelevant roadmaps.
- Feature factory bias: Frameworks sort outputs without validating problems/outcomes first, chasing “easy wins” over strategy.
- Biased inputs: Recency (loudest stakeholder), optimism (underestimated effort), or vanity metrics skew scores.
Prevalent Myths Debunked
| Myth | Reality |
|---|---|
| Frameworks guarantee perfect decisions | They’re estimation aids sparking discussion—assumptions multiply errors; true value from iteration, not math. |
| One framework fits all forever | Context dictates (RICE for data-rich, MoSCoW for sprints); evolve as product matures. |
| Quantitative = objective | Scores hide subjectivity without anchors (e.g., “Impact 3” means what?); calibrate collaboratively. |
| Prioritization ends debates | Sparks them productively—use for alignment, not elimination; document “why no.” |
| Frameworks replace strategy | They organize tactics; without clear OKRs/problem focus, they’re “malpractice” sorting noise. |
| MoSCoW is just categories | Requires caps (Must ≤60%) and reviews; else, everything’s urgent. |
| 2×2 matrices are effortless | Oversimplify—assumes known value/feasibility; pair with discovery. |